Politics
Can Kenya Become Like Singapore? Economic Growth, Election-Proof Reforms, and the 2027 Outlook
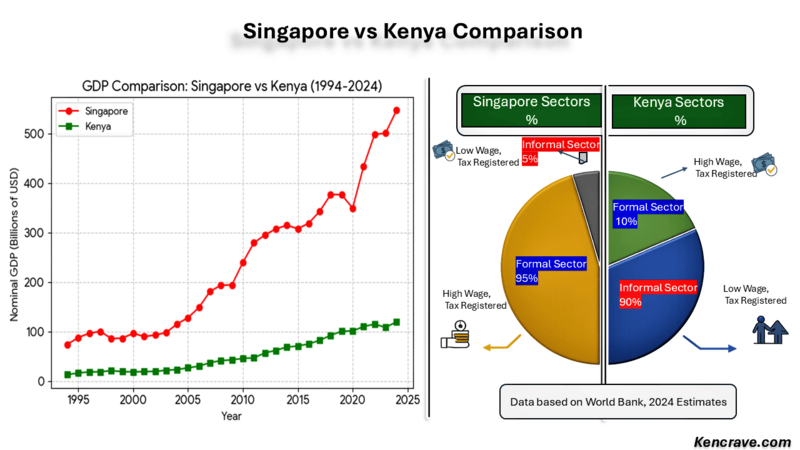
Executive Summary Kenya and Singapore started at the same GDP in 1963. By 2023, Singapore reached $500B; Kenya stayed at $113B. The difference is not resources, t's institution...

Deborah Nyangige
Apr 15, 2026 •
18 min read