

Australia has been experiencing a housing crisis. The housing crisis didn’t happen overnight. For decades Australia has not built enough homes to match growth in population and households. This persistent shortfall means more buyers and renters are chasing too few properties, pushing prices and rents higher. The crisis can be attributed to soaring demand, constrained supply, high construction costs and slow policy implementation.
The immediate impacts are record-low rental vacancy rates (<1% in many cities), over 30% of low-income households now in rental stress, and homeownership rates for young Australians collapsing. This erosion of secure housing directly undermines the stability that other social policies aim to create.
Australia's Strong Safety Nets vs Housing Market Failures
- Australia offers one of the strongest social support systems in the developed world, making its housing crisis unusual.
- Income security: Pensions, Jobseeker, Youth Allowance, family payments and income-tested transfers that reduce poverty and smooth income shocks.
- Universal healthcare: Medicare and subsidized medicines ensure access to healthcare regardless of income.
- Education and skills: Free public schooling, HECS-HELP for university, and subsidized TAFE and vocational training to support upward mobility.
- Worker protections.
However, the housing market failure actively undermines these systems. Soaring rents can consume the majority of income support payments, nullifying their purpose of providing security.
Housing stress is a key driver of mental and physical health issues, placing greater strain on Medicare. The dream of upward mobility via education is compromised when graduates cannot afford to live near employment hubs, trapped in long commutes or unaffordable rentals.
The root causes of slow policy implementation are multifaceted, including a tax system favoring investors (negative gearing, CGT discounts), restrictive local zoning, political short-termism, and community resistance to density (NIMBYism), which collectively prevent a supply-side solution.
Australia's Housing Affordability Data: The numbers behind the crisis
A new report indicates that an average of 11.4 years is needed to save for the standard 20% deposit when buying a house in most Australian cities. In early 2002, it took less than seven years to save a 20% deposit.

- Australians needed less than 7 years of savings to put up 20% of the deposit in 2002.
- It rose to 8+ years in 2010, a notable increase, reflecting the rising property prices and later on crossed the 9 year mark in 2015.
- In 2020 it entered the double digit further emphasizing the affordability challenges and is projected to be at 11.4 years in 2026.
Data from OECD shows Australia's housing supply in 2022 was 420 per 1,000 people. The number of homes being offered for sale in Australia has fallen since 2015, and the number of homes for rent has been falling since early 2020 (ABC News).
The Cotality Housing Affordability Report (CoreLogic) notes Australian home values have risen by 47.3 per cent (nearly 50%) since the COVID-19 lockdown of 2020.
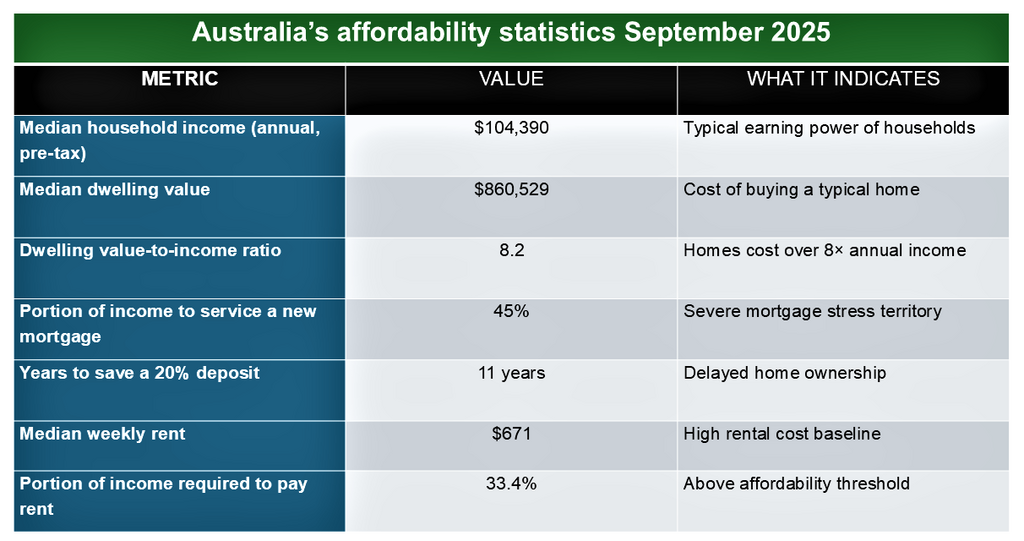
Australian housing affordability is under severe pressure.
- A median dwelling price of $860,529 which is more than 8 times the median household income. Households now need 11 years to save a 20% deposit.
- 45% of income is required to service a new mortgage.
- Renters face similar strain, spending 33.4% of income on rent, well above the affordability benchmark (House unaffordability in Australia, ABC News)

Sydney remained Australia's most expensive city, with an average of 16.7 years needed to save for a 20 per cent house deposit.
The most affordable capital cities were Darwin, where only 6.8 years of saving was needed for a 20 per cent house deposit, and Canberra (9.5 years).
The most affordable capital cities were Darwin, where only 6.8 years of saving was needed for a 20 per cent house deposit, and Canberra (9.5 years).
$26 Billion Plan vs Reality: Australia's Housing Policy Deliver Gap
The government has made nearly $26 billion in commitments to the housing problem. In the 2024-2025 budgets, it added another $6.2 billion in new commitments to the cause. Those measures will complement the well-publicized "target" to build 1.2 million new, well-located homes over five years, starting from 1 July 2024 to mid-2029.
What's been promised
The measures include:
1. An extra $1 billion to states and territories in support of the Housing Program to help them build infrastructure for new housing (sewage, road, water and power). 500 million had been previously committed.
2. $1.9 billion to increase the maximum rates of Commonwealth Rent Assistance by a further 10 per cent to alleviate rental stress.
3. $88.8 million for 20,000 new fee-free technical and further education (TAFE) in courses relevant to the construction sector.
4. An additional $1.9 billion in concessional loans to community housing providers and other charities to support delivery of new social and affordable homes under the Housing Australia Future Fund and National Housing Accord.
5. Allow foreign investors to purchase established build to rent developments with a lower foreign investment fee.
6. $423m in additional funding to the National Agreement on Social Housing and Homelessness to boost support for social housing and homelessness services (National Housing Homelessness Plan).

- Rent Assistance & Social Housing dominate the allocation at $1.9B each, reflecting strong investment in housing affordability.
- Infrastructure receives $1.5B, a significant share aimed at long-term development.
- Homelessness support is allocated $0.42B, showing targeted but smaller-scale funding.
- Skills Training receives the least at $0.09B, suggesting limited emphasis compared to housing and infrastructure.
What has been delivered:
Government Progress to Date:
- Supply in Motion: Pipeline data confirms tens of thousands of homes are under construction or completed, though the current pace remains below the 1.2-million-home target.
- Immediate Rent Relief: Increased Commonwealth Rent Assistance payments are active, providing direct support to eligible households.
- Long-Term Capacity Building: Fee-free TAFE and construction pre-apprenticeships (2024–25) are underway to address chronic skilled labour shortages, a multi-year solution.
- Social Housing Pipeline: Contracts for approximately 18,650 new social and affordable homes have been finalized, backed by over $1.2 billion in approved federal loans and grants.
.png)
Six Critical Barriers: Why Australia can't build enough homes
1. Build capacity is too low: The 1.2 million target requires an estimated 240,000 homes per year, which is above Australia’s sustained historical construction capacity.
2. Severe labour shortages: A lack of skilled trades (builders, electricians, plumbers) limits how many homes can be built and training new workers takes years.
3. High construction and financing costs: Rising material prices, builder insolvencies, and higher interest rates have made many approved projects financially unviable.
4. Planning and zoning delays: Local planning restrictions and slow rezoning processes continue to block higher-density housing where demand is highest.
5. High interest rates slowed private building: Most homes are built by the private sector, which reduced activity due to higher borrowing costs.
6. The target is non-binding: States face no penalties for missing benchmarks, leading to uneven delivery and weak enforcement.

- The targets were missed because of labour Shortages which contributed to 40% of the cumulative failure highlighting workforce availability issues.
- High Costs (35%) represent the second largest challenge, reflecting financial constraints.
- Planning delays (25%) contribute a quarter of missed targets, showing the impact of inefficiencies in project management.
Global Comparisons: UK, Canada and the Limits of Policy
United Kingdom (UK)
In the UK, the housing crisis is driven by long-term underbuilding, particularly in London and the South East, combined with restrictive greenbelt policies that limit new development.
High demand from a growing population and international investors has pushed house prices far beyond average incomes, leaving many first-time buyers struggling to enter the market. The UK government has taken initiative by:
High demand from a growing population and international investors has pushed house prices far beyond average incomes, leaving many first-time buyers struggling to enter the market. The UK government has taken initiative by:
- Affordable/social housing funding (an estimated £2 billion).
- Social Housing (Regulation) Act 2023.
- Help to buy scheme for first-time buyers.

- 3.0 (Affordable)
- 5.1 (Severely Unaffordable Threshold
- 8.3 (Toronto baseline)
Key insights: Global housing affordability comparison
- Hong Kong is in a League of Its Own: With a ratio near 17, it is consistently the world's most unaffordable market. Housing costs are attributed to by extreme land scarcity, investment demand, and geographic constraints.
- Dominance of "New World" Anglosphere Cities: Australian, Canadian, New Zealand and U.S. cities dominate the list. This reflects a shared set of challenges: restrictive zoning housing as a financialized investment asset, and supply systems that fail to respond elastically to demand.
- The Canadian duo,Vancouver (3rd) and Toronto (10th) highlight a parallel crisis to Australia's, driven by high immigration and supply constraints
- The U.S. Tech Hub:San Jose (4th), Los Angeles (7th), and San Francisco (8th)represent the high-cost U.S. coastal model, where high wages meet extremely restrictive land-use policies thus crippling supply.
Canada
Meanwhile, Canada faces a similar challenge, especially in urban centers like Toronto and Vancouver, where limited housing supply, restrictive zoning and strong demand from immigration and investors have caused prices and rents to soar. The initiatives are:
- National Housing Strategy with federal investment.
- Build Canada Homes agency (an estimated $13 billion).
- Intergovernmental coordination for approvals & financing.
- Policy innovations: public land, GST relief, modern construction technology.
Canada has the largest coordinated federal effort, using a dedicated agency and multi-billion-dollar funding. Australia combines supply targets with social housing and rent assistance, but targets are ambitious and behind schedule. Meanwhile, the UK focuses on tenant protection and targeted subsidies but struggles with supply in high-demand areas.
What Australia can learn from Japan's Housing Success
Japan-it has kept housing relatively affordable for decades, even in Tokyo, one of the world’s largest cities and it does this without massive subsidies or rent controls.
What Japan does right
- By-right zoning: If land is zoned residential, building approval is fast and predictable.
- High-density acceptance: Apartments, mixed-use, and infill housing are normal, not controversial.
- Continuous building: Japan builds a lot of homes every year, even as population growth slows.
- Housing treated as infrastructure, not an investment vehicle
Global Implications: Housing as Economic Risk in Advanced Economies
1. A warning for other advanced economies. Australia shows that even wealthy, stable countries can reach crisis-level unaffordability if housing supply cannot respond quickly to demand. This is highly relevant for countries like Canada, the UK, Ireland, and parts of the EU facing similar pressures.
2. Housing as a global inflation and inequality driver. When housing absorbs 30–45% of household income, it limits consumer spending elsewhere, worsens wealth inequality between owners and renters and pushes younger generations into long-term precarity
Globally, this reinforces the idea that housing is now a central economic risk, not just a social issue.
3. Constraints on labour mobility. High housing costs reduce workers’ ability to move to where jobs are which lowers productivity, worsens skill shortages and makes cities less competitive.
4. A case study in policy limits. Australia demonstrates that funding alone is insufficient without planning reform and non-binding targets don’t deliver supply. This emphasizes the importance of great policy implementation.
4. A case study in policy limits. Australia demonstrates that funding alone is insufficient without planning reform and non-binding targets don’t deliver supply. This emphasizes the importance of great policy implementation.
The Way Forward: Policy, Markets, and Citizens
Australia’s housing crisis cannot be solved by funding alone. The path forward requires structural reform, sustained supply, and shared responsibility across government, markets, and society.
- Fix supply at scale. Housing targets should be binding, coordinated nationally and backed by infrastructure delivery.
- Treat housing as essential infrastructure. Social and affordable housing should be built continuously, at scale, and not for political cycles
- Rebuild construction capacity. Skilled migration, apprenticeships and modern building methods must expand the industry’s ability to deliver homes efficiently and at lower cost.
- Rebalance housing as a home, not just an asset. Tax, investment, and regulatory settings should prioritize long-term rental stability and livability over speculative price growth.
- Align population growth with housing delivery. Migration, labour needs, and urban planning must move together to prevent future shortages.
For Investors Briefing
Short term:
- Focus on essential rentals in resilient middle‑ring suburbs near hospitals, schools and transport.
- Support build-to-rent models by partnering with government and institutions to increase housing supply.
Medium term:
- Invest in construction enablers: prefabrication, materials innovation, and proptech.
- Invest outside overheated markets: Look beyond major capitals where affordability and demand fundamentals are more balanced; Perth, Adelaide, Brisbane or key regional hubs.
Long term:
- Shift metrics from speculation to stability, efficiency and social impact.
- Diversify into alternative real assets (healthcare, logistics) to reduce exposure to housing policy volatility.
- Anchor strategy on long-term rental income rather than short-term capital gains.
Key Takeaways: Australia's Housing Crisis
1. Australia’s housing crisis is structural; it is driven by long-term undersupply rather than short-term shocks.
2. Housing costs now consume 30–45% of household income, undermining living standards despite a strong welfare system. Government funding and targets exist, but delivery is constrained by labour shortages, planning delays, and high construction costs.
3. The 1.2 million homes target is ambitious but currently behind pace, highlighting capacity limits.
4. International comparisons show Australia’s challenge is shared globally, but countries that prioritize fast, flexible supply perform better.
5. Lasting affordability will require planning reform, sustained construction capacity, and housing treated as essential infrastructure.
FAQs: Australia's Housing Crisis Analysis
1. What is the main cause of Australia's housing crisis?
The crisis is primarily caused by a structural and decades-long shortfall in housing supply failing to keep pace with population and household growth. This fundamental imbalance is exacerbated by high construction costs, soaring demand, and slow policy implementation.
The crisis is primarily caused by a structural and decades-long shortfall in housing supply failing to keep pace with population and household growth. This fundamental imbalance is exacerbated by high construction costs, soaring demand, and slow policy implementation.
2. How can Australia have a strong social safety net but a housing crisis?
Australia's robust social supports (like Medicare and income security) exist alongside the housing crisis, which highlights a specific market and policy failure. The crisis actively undermines these other systems, as high housing costs consume welfare payments and negatively impact health and mobility.
Australia's robust social supports (like Medicare and income security) exist alongside the housing crisis, which highlights a specific market and policy failure. The crisis actively undermines these other systems, as high housing costs consume welfare payments and negatively impact health and mobility.
3. What are the immediate impacts of the housing crisis in Australia?
The most immediate impacts are severe rental stress (with over 30% of low-income renters affected), record-low vacancy rates, and a collapse in homeownership rates among younger generations, eroding long-term economic security.
The most immediate impacts are severe rental stress (with over 30% of low-income renters affected), record-low vacancy rates, and a collapse in homeownership rates among younger generations, eroding long-term economic security.
4. Why has Australian policy failed to fix the housing crisis?
Policy implementation has been slow due to a combination of factors: tax incentives favoring investors (e.g., negative gearing), restrictive local zoning laws, political short-termism, and community resistance to increased density (NIMBYism).
Policy implementation has been slow due to a combination of factors: tax incentives favoring investors (e.g., negative gearing), restrictive local zoning laws, political short-termism, and community resistance to increased density (NIMBYism).
5. What is the link between housing and social mobility in Australia?
The analysis finds that the housing crisis directly compromises social mobility. Even with strong education supports like HECS-HELP, high housing costs and unaffordable locations near jobs trap individuals, limiting the upward mobility other social policies aim to create.
The analysis finds that the housing crisis directly compromises social mobility. Even with strong education supports like HECS-HELP, high housing costs and unaffordable locations near jobs trap individuals, limiting the upward mobility other social policies aim to create.