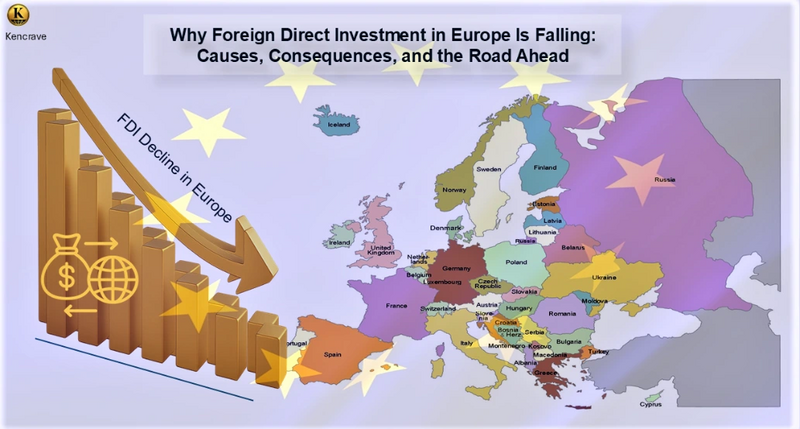
Foreign Direct Investment (FDI) has long been a cornerstone of Europe’s economic growth, job creation, and technological progress. FDI typically involves long-term strategic commitments, such as acquiring at least 10% of voting shares in a foreign enterprise. It's important to note that the cited EY survey data measures FDI projects, which include new physical operations like manufacturing plants and R&D centers, capturing the broader trend of investment commitments.
Key Takeaway: Europe’s decline in foreign direct investment is not cyclical, it reflects a structural loss of competitiveness driven by geopolitical risk, regulatory complexity, and stronger industrial incentives in rival economies.
Yet Europe’s investment climate has shifted sharply. According to the EY Europe Attractiveness Survey (2025), Europe recorded its lowest number of FDI projects in nine years during the 2024–2025 period. This decline signals a structural change in global investment patterns and raises urgent questions about Europe’s competitiveness.
FDI projects in Europe 2015 to 2025 line graph showing record peak in 2017, post‑pandemic surge, and projected structural decline to 2024 low.
While part of the downturn reflects a broader global slowdown in capital expenditure following the post-pandemic surge, the scale and persistence of Europe’s decline suggest deeper issues tied to geopolitics, regulation, and industrial strategy. This trend is particularly acute for Europe, as investment flows are increasingly re-concentrating in North America and East Asia.
Causes of Europe’s FDI Decline: Geopolitics, Regulation, and Energy Costs
Geopolitical instability has become a major deterrent for foreign investors. The ongoing Russia–Ukraine war has elevated risk perceptions across the continent, particularly in Central and Eastern Europe. Trade uncertainty and political risk have weakened investor confidence throughout the region.
Regulatory complexity has constrained Europe’s appeal. In February 2025, EU officials acknowledged that excessive administrative and sustainability-related requirements were limiting competitiveness, prompting renewed discussions on regulatory reform.
While environmental standards are a core European value, slow permitting processes, fragmented national rules, and overlapping reporting obligations raise project costs and extend timelines, critical factors for multinational investors deciding where to locate new facilities.
High energy prices compound these challenges. Compared to the United States and parts of Asia, European manufacturers face structurally higher electricity and gas costs, reducing margins and long-term predictability. For example, industrial electricity prices in key economies like Germany have remained multiples of those in the U.S., driven by geopolitical supply shifts and network costs.
Structural Competitiveness and Manufacturing Shifts
Europe’s FDI decline reflects deeper structural competitiveness issues. Relative to the United States and China, Europe struggles with:
Slower industrial scaling.
Fragmented industrial policy across member states.
Smaller, less integrated capital markets.
EY reports a sharp fall in manufacturing investment in 2024, as capital increasingly flows toward the U.S. and China. The U.S. Inflation Reduction Act and CHIPS Act provide large, clear fiscal incentives, while China offers scale, speed, and tightly integrated supply chains. These environments reduce uncertainty and accelerate returns as decisive advantages for global firms.
Europe’s policy response, by contrast, remains uneven. National subsidy regimes differ widely, and cross-border projects still face legal and bureaucratic friction within the single market.
FDI inflows comparison chart Europe United States China 2020 to 2025 showing investment trends and projections.
Key Insightsfrom the Actual FDI Inflows: Europe vs. United States vs. China (2020–2025) Europe
Highly volatile flows: from $151B in 2021 to –$106B in 2022 (a net outflow).
Weak recovery: only $16B in 2023, then estimated $182B in 2024 and projected $170B in 2025.
This volatility reflects financial conduit flows (e.g., Luxembourg), making Europe less stable for FDI.
United States
Consistently strong inflows: peaked at $388B in 2021, then stabilized around $285–343B.
Projected to remain the global leader with $330B in 2025, showing resilience and investor confidence.
China
Moderate but steady inflows: $144B in 2020 → $189B in 2022, then declining to $115B (2024 est.) and$108B (2025 proj.).
Reflects reduced green financial FDI and policy-driven shifts, though still significant in scale.
Strategic Implications
Investor Confidence: The U.S. remains the most attractive destination due to policy stability and strong market fundamentals, reinforcing its role as the global FDI hub.
Europe’s Challenge: Persistent volatility undermines investor trust, signaling the need for structural reforms, reduced reliance on financial conduit flows, and stronger strategic autonomy.
China’s Shift: Declining inflows highlight the impact of geopolitical tensions and reduced green finance, pushing China to diversify supply chains and recalibrate its investment model.
Global Capital Reallocation: Investors are increasingly de‑risking by redirecting funds toward stable, policy‑backed markets (U.S.) and emerging hubs in Asia, reshaping the global investment landscape.
Takeaway: FDI flows are realigning toward stability and strategic industries, leaving Europe at risk of marginalization unless it adapts.
Regional Fragmentation of FDI in Europe
The downturn in foreign investment in Europe is not uniform. Central, Eastern, and Southeastern Europe have suffered the steepest declines. According to data cited by EY, total inflows to these regions fell by roughly 25% in 2024. Poland alone experienced a 48% drop.
These disparities reflect:
Higher exposure to geopolitical risk.
Weaker infrastructure in some regions.
Lower fiscal capacity to match U.S.-style incentives.
The result is a widening investment gap between Europe’s core economies and its periphery, threatening long-term convergence within the EU.
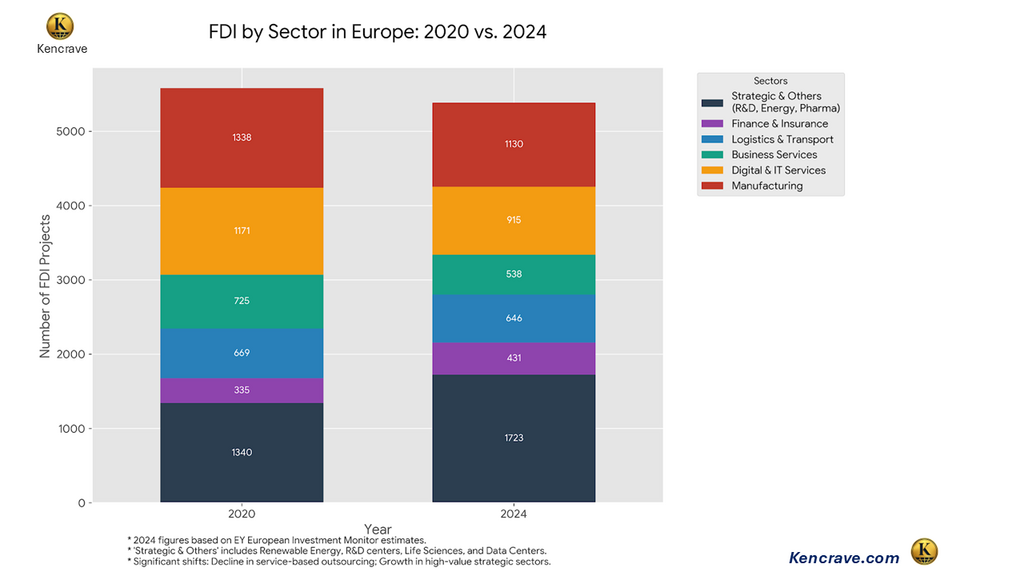
Sectoral Shifts and the Decline of U.S. Investment
A notable feature of recent FDI trends in Europe is the contraction of U.S.-sourced investment. EY reports that jobs created through U.S. investment in Europe have almost halved in recent years, indicating a strategic reorientation toward domestic U.S. production.
FDI by sector in Europe 2020 vs 2024 bar chart showing investment trends across manufacturing, digital services, finance, logistics, and strategic industries.
Europe remains competitive in logistics and segments of the electric vehicle supply chain. However, high-growth sectors like advanced semiconductors, artificial intelligence, and green energy manufacturing, are increasingly gravitating toward North America and East Asia, where incentives are larger and deployment is faster.
What Europe Can Do: Policy Levers to Restore Investment Appeal
To reverse these trends, Europe must move from diagnosis to action. Key reforms could include:
Regulatory simplification: Streamlining permitting, harmonizing standards across member states, and reducing overlapping reporting requirements.
Targeted fiscal incentives: Coordinated EU-level tax credits and subsidies for strategic sectors such as semiconductors, batteries, AI, and clean energy.
Energy cost stabilization: Long-term power pricing mechanisms for industrial users and accelerated grid investment.
Single-market deepening: Faster cross-border project approvals and unified capital markets to support large-scale investments.
These measures would not replicate U.S. or Chinese models but could restore predictability and scale, two qualities investors value most.
Capital reallocation in strategic assets chart showing Europe’s shift 2020 to 2024 with global investment flows to USA, South East Asia, and China driven by industrial policy and geopolitical realignment.
Long-Term Implications for European Competitiveness
Persistently lower FDI threatens Europe’s position in critical future industries. Reduced investment in AI, renewable energy, and advanced manufacturing may:
Slow productivity growth.
Weaken innovation ecosystems.
Limit high-skilled job creation.
Over time, this could widen the economic gap between Europe, the United States, and Asia.
Bottom Line
Nonetheless, the EY Europe Attractiveness Survey notes cautious optimism. If regulatory reform and industrial coordination materialize, Europe can still leverage its strengths: political stability, skilled labor, and a large consumer market. This optimism is partly underpinned by nascent EU initiatives like the Net-Zero Industry Act and ongoing efforts to advance the Capital Markets Union, which aim to directly address some identified barriers.
Key Takeaways: Foreign Direct Investment in Europe
Europe’s FDI decline reflects structural weaknesses, not just a temporary global slowdown.
Geopolitical risk and regulatory complexity have become decisive deterrents for investors.
The U.S. and China are attracting capital through scale, speed, and aggressive industrial policy.
Central and Eastern Europe are disproportionately affected, widening intra-EU divergence.
Recovery depends on regulatory simplification, energy cost stabilization, and coordinated EU-level industrial strategy.
FAQ: Foreign Direct Investment in Europe
1.Why is FDI falling in Europe in 2025? FDI is declining due to geopolitical risk, regulatory complexity, high energy costs, and stronger incentives in the U.S. and China.
2. Which European countries are most affected? Central and Eastern European states have seen the largest drops, with Poland experiencing nearly a 50% decline in inflows.
3. Is Europe losing competitiveness? Relative to the U.S. and China, Europe is struggling to offer the same scale, speed, and certainty for investors in strategic sectors.
4.Can FDI in Europe recover? Yes, but recovery depends on regulatory simplification, coordinated industrial policy, and energy market reform.
Since its public introduction, artificial intelligence (AI) has evolved from a niche technology into a strategic growth driver for modern businesses. Its ability to analyze vast datasets, automate complex workflows, and generate predictive insights has reshaped how companies compete, innovate, and serve customers in the digital economy. This transformation has sparked intense AI adoption in business strategy, with organizations increasingly viewing AI as foundational to competitive advantage in areas such as innovation, supply chain optimization, and customer experience.
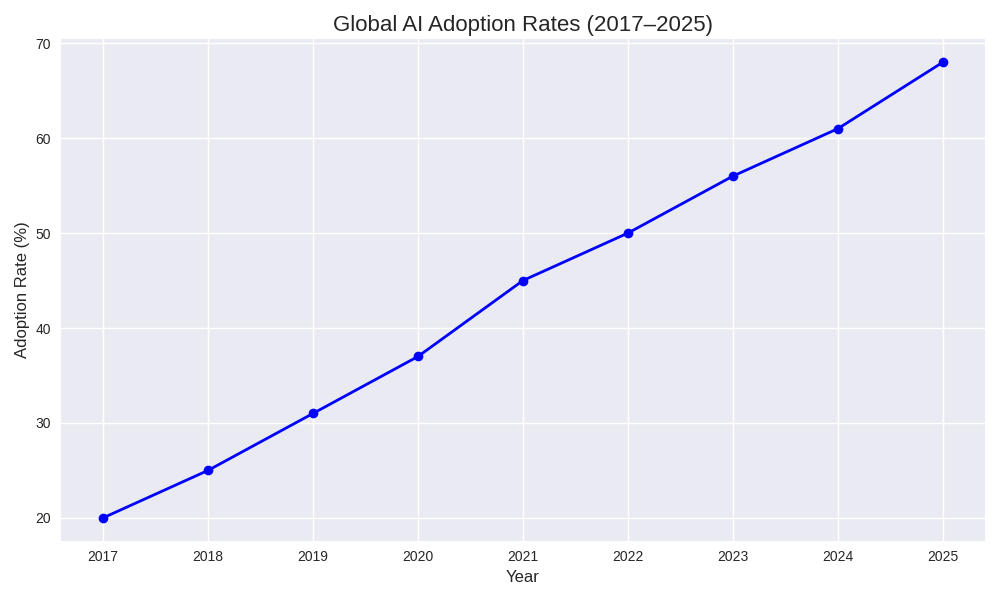
According to the McKinsey 2024 Global AI Survey, AI adoption surged globally to 72% of organizations reporting AI use in at least one business function, reflecting the rapid diffusion of AI across industries and business operations.
Global AI adoption rate 2017- 2025 line chart showing steady growth from 20% to 68% worldwide. Sources: McKinsey State of AI 2024, Statista, and Learn Hub | G2.
Key Insights from the chart
Early adoption (2017–2019): Mostly experimental, with AI used in niche applications.
Generative AI boom (2023–2025): Tools like ChatGPT and DALL·E pushed adoption rates sharply higher, especially in enterprise and consumer sectors.
AI Integration in Modern Business Development
Across sectors, companies are embedding AI‑driven automation, predictive analytics, and business intelligence tools into core processes such as data analytics, cybersecurity, customer service, and market forecasting. By leveraging machine learning models, natural language processing (NLP), and generative AI, firms can identify demand trends, personalize customer experiences, and optimize resource allocation with unprecedented speed and precision.
More than just improving operational efficiency, AI enables innovation pipelines that accelerate product development cycles and support cross‑functional strategic partnerships between tech developers, suppliers, and enterprise customers. As a result, AI is strengthening enterprise value chains and helping businesses unlock new revenue streams and market opportunities.
North American Case Studies of AI Adoption
In North America, AI adoption is particularly advanced and widespread:
Spotify’s AI DJ Feature: Spotify introduced its AI DJ in 2023 to craft personalized music streams based on individual listening behavior, enhancing user engagement and retention.
Figure AI and BMW Manufacturing: In 2024, BMW partnered with Figure AI to deploy AI‑powered humanoid robots in manufacturing lines to reduce worker fatigue and increase productivity, demonstrating practical applications of AI in industrial automation.
These cases illustrate how AI enhances both consumer‑facing services and industrial operational systems, showcasing the technology’s versatility in business transformation.
Why North America Has an Edge in AI Adoption
North America’s leadership in AI adoption stems from several distinct factors:
1. Strong Venture Capital Culture
The region benefits from robust venture capital (VC) ecosystems that fuel early‑stage funding for AI startups. Major investors are backing companies focused on enterprise AI tools, autonomous systems, and predictive analytics, which accelerates technology scaling and market penetration.
2. Top‑Tier Research Universities
Institutions like MIT, Stanford, and the University of Toronto produce cutting‑edge AI research, highly skilled graduates, and industry partnerships that feed into innovation pipelines across sectors.
3. Dense Tech Clusters
Tech hubs such as Silicon Valley, Boston–Cambridge, and Toronto‑Waterloo facilitate collaboration between startups, established enterprises, and research labs, accelerating AI commercialization and workforce development.
4. Regulatory Environment
While regulatory frameworks around data privacy and AI ethics continue to evolve, the relative flexibility of North American policy environments has enabled faster experimentation and adoption of emerging AI capabilities compared with more rigid regulatory regimes.
North America vs China AI adoption metrics: innovation drivers, funding, regulation, and commercialization speed
North America’s private‑sector‑driven model contrasts with China’s state‑led AI strategy, shaping different patterns of investment, deployment, and innovation across global markets.
AI Investment: North America vs Global Trends
Recent data from Statista indicate that North America maintained the highest regional AI adoption rate in 2023, reflecting strong enterprise investment and the integration of AI tools into business workflows. Additionally, regional AI investment analyses highlight that North America commanded a significant share of global AI funding in recent years, signaling sustained investor confidence in AI innovation and commercialization.
This concentration of AI investment reinforces the region’s role as a global AI hub, attracting talent, capital, and strategic partnerships that drive enterprise growth.
Risks, Regulation, and Ethical Considerations
Despite its strategic advantages, AI adoption introduces significant challenges, including data privacy concerns, model bias, workforce displacement, and ethical decision‑making frameworks. Organizations must navigate these risks while ensuring responsible AI governance, transparent data practices, and compliance with emerging regulatory frameworks like Canada’s Artificial Intelligence and Data Act.
Extended Implications for North American Businesses
AI’s influence goes beyond productivity and customer engagement to reshape core business dynamics:
1. Innovation Pipelines
AI accelerates R&D cycles and new product development by enabling faster hypothesis testing, automated prototyping, and data‑driven experimentation.
2. Supply Chain Optimization
AI‑driven predictive modeling enhances logistics planning, demand forecasting, and inventory management, reducing overhead and improving resilience in complex supply networks.
3. Strategic Partnerships
AI insights empower organizations to form data‑centric alliances with suppliers, technology partners, and channel distributors, strengthening ecosystem integration.
Key Takeaways: AI Adoption by Modern Businesses
AI is increasingly becoming a core foundation of business development across sectors.
North America leads in AI adoption due to strong venture capital ecosystems, talent pipelines, and tech clusters.
AI integration supports not just efficiency, but innovation, supply chain optimization, and strategic ecosystem partnerships.
Global comparisons show North America’s private‑sector‑led AI strategy contrasts with China’s state‑directed approach.
To maximize value, businesses must balance AI investment with ethical, regulatory, and risk management strategies.
Bottom Line
AI is no longer optional for modern enterprises; it is central to long‑term competitiveness, strategic innovation, and sustainable growth.
FAQs
1. Why is AI adoption critical for modern business development? AI enables data-driven decision-making, automation, innovation acceleration, and competitive advantage across operations, products, and customer experience.
2. How is artificial intelligence used in business today? Businesses use AI for predictive analytics, customer personalization, supply chain optimization, cybersecurity, automation, and generative AI applications.
3. Why does North America lead in AI adoption? North America benefits from strong venture capital ecosystems, top AI research universities, dense tech clusters, and faster commercialization of AI technologies.
4. How does AI improve supply chain and operational efficiency? AI enhances demand forecasting, inventory management, logistics optimization, and risk detection through real-time data analysis and predictive modeling.
5. How does North America’s AI strategy differ from China’s? North America relies on private-sector innovation and startups, while China emphasizes state-led AI initiatives and large-scale industrial deployment.
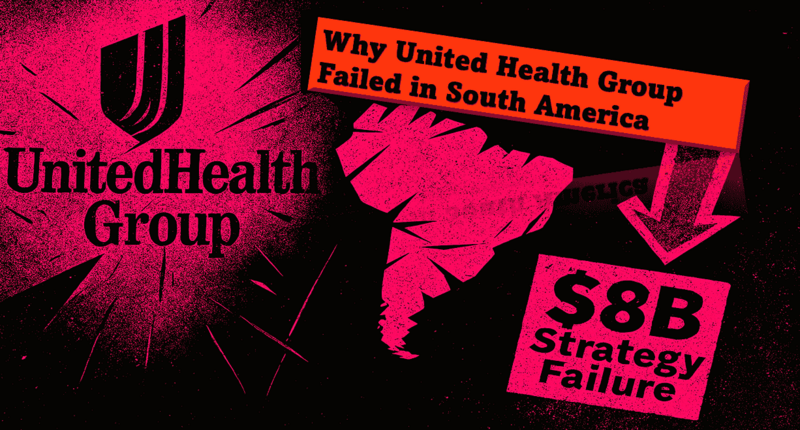
UnitedHealth Group’s (UHG) costly exit from South America marks a decisive strategic pivot from global ambition to domestic fortification. Triggered by over $8 billion in cumulative losses, relentless regulatory scandals in Brazil, and mounting pressures on its core U.S. business, the retreat underscores the fatal mismatch between a capital-intensive, vertically integrated U.S. model and the volatile realities of emerging markets. This analysis details the exit’s drivers, contrasts UHG’s failed approach with the adaptive strategies of peers, and outlines the resulting shift toward asset-light, partnership-driven investment in global healthcare.
THE FINANCIAL CATASTROPHE: $8 BILLION IN LOSSES EXPLAINED
UnitedHealth Group (UHG) announced its intention to exit South America in phases beginning late 2022 following a strategic review of its international operations. The withdrawal was not abrupt; it unfolded over several years through asset sales and restructuring. As of November 30, 2025, UnitedHealth Group agreed to sell its last South American business, Banmedica, which operated primarily in Chile and Colombia, to Brazilian private equity group Patria Investments for $1 billion. Reuters
Banmedica is a major health insurer that also runs hospitals and medical centers, with around 1.7 million health insurance members, 7 hospitals and 47 medical centers acrossChile and Colombia.
REASONS FOR LEAVING SOUTH AMERICA AND WHY THE EXIT TOOK SO LONG
UHG sought to refocus on its core U.S. Business strategically.
The non-core markets provide constant operational barriers due to complex local regulations, political and economic volatility (especially in Brazil), currency exchange risks, and fierce competition from well-established local players.
Rising medical cost trends and operational pressures at Optum and other units in the U.S. Due to margin pressure from inflation, labor shortages and elevated medical utilization post-pandemic.
Leadership turnover, including a CEO change that looks to streamline operations, simplify the corporate structure and focus on the most critical growth and stability levers.
In February 2024, UnitedHealth Group suffered a major cyberattack on its Change Healthcare unit after attackers exploited compromised login credentials on a remote access portal that lacked multi-factor authentication. The breach led to widespread system shutdowns, disrupting the largest medical billing and claims processor in the U.S. healthcare system. This accelerated the strategic imperative to simplify operations, reduce peripheral risk exposure, and concentrate capital and leadership attention on the core U.S. market (Change Healthcare).
Why the Exit Took So Long: The Problem with "Hard" Assets
UHG couldn't leave South America quickly because of the very strategy that failed: investing in "hard" assets like hospitals and insurance companies.
Hard to Sell: You can't sell a network of hospitals and clinics as easily as you can sell an app or a service. Finding a buyer with enough money and the right government approvals takes a long time.
Governments Were Watching: Healthcare is a sensitive public service. Governments in Chile, Colombia, and Brazil closely watched the sale to make sure patient care wouldn't be disrupted, which slowed everything down.
They Needed a Responsible Buyer: UHG wanted to sell to a company that could keep the hospitals and clinics running well. This limited their options and made negotiations longer.
A Quick Sale Would Have Cost More: If UHG had rushed to sell, they would have had to accept much lower prices, losing even more money.
Bottom Line:UHG's big investments in physical assets locked them in. When they decided to leave, they were stuck in a slow, expensive, and very public exit process. This is a major risk of the "hard capital" model.
How the Cyberattack Sped Up the Exit
The massive cyberattack on UHG's U.S. business in 2024, targeting its subsidiary, Change Healthcare, becameone of the largest healthcare data breaches in U.S. history. It didn't just cause a mess; it forced the company to make a fast, hard choice about its priorities.
It showed UHG was Vulnerable at home: The attack proved that UHG's core U.S. business was not as secure as they thought. Fixing this huge problem required the attention and resources of the entire management team.
"Protect America First" Became the Rule: After the attack, the only mission was to protect and strengthen the main U.S. business. Struggling operations in South America suddenly looked like a dangerous distraction.
Money Had to Move Fast: The attack cost billions to fix. UHG could no longer afford to spend money propping up its South American losses. That cash was now needed at home.
A Decision Became an Emergency: Leaving South America went from being a "smart strategic move" to an "urgent necessity." The cyberattack made the company's leadership act faster to get out.
Bottom Line:The cyberattack was a wake-up call. It made UHG realize it was spread too thin. Protecting its home base became the only thing that mattered, which meant getting out of South America as soon as possible.
Why the exit is notable
UnitedHealth Group is the largest health insurer in the world, and its withdrawal represents a rare retreat by a global healthcare giant.
The company exited at a substantial financial loss, estimated at over $8 billion in cumulative write-downs.
The exit highlights the difficulty of exporting a U.S.-style, vertically integrated healthcare model into politically sensitive and highly regulated emerging markets.
UNITEDHEALTH GROUP’S HISTORY IN SOUTH AMERICA: ENTRY AND EXPANSION
United Healthcare South America timeline: Brazil entry (2012), Banmédica acquisition (2018), regulatory challenges, strategic retreat, final exit (2025). Source: IPMI Global
UnitedHealth Group’s expansion coincided with a window of regulatory permissiveness that closed permanently after governance failures.
DECODING SUCCESS: THE ADAPTIVE PLAYBOOKS OF BUPA, AETNA, AXA, AND ALLIANZ.
UnitedHealth Group’s exit prompted a cautious reassessment among global healthcare firms. Most did not exit South America, but adjusted their strategies. Global insurers increasingly favor partnerships, joint ventures or insurance-only models.
1. Aetna / CVS Health(U.S)
It is U.S.-centric but has selective international exposure via services, but not ownership.
Contrast: avoids the regulatory and political risk UHG struggled with.
2. Bupa (UK).
Operates under a long-term, slow-growth model and accepts thinner margins in exchange for regional stability.
Contrast: Bupa is patient; UHG wanted scale and faster returns.
3. Axa (France)
Reduced exposure but did not fully exit. Pivoted to partnerships and reinsurance rather than retail health insurance.
Contrast: risk-sharing instead of full ownership.
4. Allianz (Germany)
Focuses on corporate health and specialty insurance.
Contrast: avoids mass market retail and is less exposed to political backlash over pricing and coverage.
Comparative chart of UnitedHealth Group model assumptions versus emerging market realities, highlighting scale, vertical integration, capital strength, and growth challenges.
COMPETITIVE VIEW: THE LOCAL CHAMPIONS THAT UNITED HEALTH GROUP COULD NOT DISPLACE
While UHG struggled, several well-entrenched local and regional players demonstrated how to succeed in South America's complex healthcare markets. Their success underscores the critical strategic missteps of the UHG approach.
1. Hapvida NotreDame Intermédica (HNDI)
Model: Hyper-localized vertical integration Why They Succeeded
Geographic Concentration: HNDI built dense, regional networks
Cost Control through Ownership: By owning hospitals, clinics, and labs, they control the entire care chain, reducing leakage and managing medical costs more effectively
2. Bradesco Saúde /OdontoPrev
Model: Financial-Health Conglomerate Synergy leveraging Brazil's largest private banking network. Why They Succeeded:
Cross-selling Ecosystem: Integrates health insurance with banking products, payroll services, and corporate benefits creating high customer stickiness
Local Regulatory Mastery: Deep, long-standing relationships with Brazilian regulators allow for more predictable navigation of policy changes.
3. Grupo de Empresas (Chile) / Keralty (Colombia)
Model: Cooperative & Social Enterprise with strong community embeddedness. Why They Succeeded:
Mission Alignment over Pure Profit. It was structured as non-profits/ cooperative.
Lower Capital Costs: As member-owned or socially-focused entities, they can operate with thinner margins and reinvest surpluses
Community-Based Care Networks: They built grassroots provider networks aligned with local practice patterns
4. Fresenius Medical Care
Model: Specialized, Niche Dominance in renal care and dialysis services. Why They Succeeded (as a multinational contrast to UHG):
Focused Expertise. Instead of tackling the entire healthcare system, they dominate a single, high-need clinical segment where they can be the undisputed quality and cost leader.
Government Partnership Focus: Much of their business comes from public sector
Comparative table of UnitedHealth Group vs South America local champions showing ownership, regulatory ties, cost structure, and time horizon.
EXPECTED CHANGES FROM THE SALE AND MARKET IMPACT
Short-term effects
Minimal disruption for patients.
Continuity of services under new ownership.
Existing insurance contracts remain valid.
Medium- to long-term effects
Increased cost discipline under private equity ownership.
Possible restructuring of hospital networks.
Gradual pricing adjustments and tighter claims management.
Greater emphasis on efficiency and profitability.
WHY UNITEDHEALTH GROUP FAILED IN SOUTH AMERICA
UHG’s failure was not operational incompetence, but strategic overconfidence, assuming that scale, capital strength and vertical integration would translate seamlessly across borders. In South America, success favored local legitimacy, regulatory intimacy, cost discipline and long-term patience, areas where domestic competitors held decisive advantages.
1. Capital-Heavy, Highly Visible Model
UHG invested heavily in owned hospitals, clinics, and insurance balance sheets, most notably through Amil (Brazil) and Banmédica (Chile/Colombia). These assets required large upfront capital, long payback periods, and continuous reinvestment. Owning hospitals made UHG politically and regulatorily exposed, especially during pricing disputes or capacity shortages.
2. Healthcare Is Deeply Political in South America
Healthcare pricing, coverage, and service quality are treated as social and political issues, not purely commercial ones. Governments intervene aggressively when public dissatisfaction rises. Following the 2016 Amil corruption scandal in Brazil, regulators intensified scrutiny of private insurers. UHG, as a foreign multinational, became an easy political target.
3. Underestimated Currency and Macroeconomic Risk
UHG generated revenues in volatile local currencies while reporting earnings in U.S. dollars, exposing returns to persistent depreciation and inflation shocks.
4. Lack of Patience for Slower, Lower-Margin Growth
Emerging market healthcare rewards long-term presence, incremental expansion, and operational discipline, not rapid scaling or short-cycle returns. UHG sought scale efficiencies similar to its U.S. operations, expecting margins that were unrealistic in price-sensitive markets.
5. Fragmented and Unpredictable Regulatory Environments
South America is not a single regulatory market. Each country and region has distinct rules on pricing, coverage, ownership and capital requirements.UHG faced different regulatory regimes in Brazil, Chile, and Colombia, complicating compliance, governance, and strategic coordination.
Bar chart of UHG regulatory intensity in Brazil from 2012 to 2022, showing spikes in 2016 and 2021.
Key Insights:
Before 2016, there weremanageable regulations, thus business can operate effectively. After the 2016 scandal, the police raided Amil's offices, and executives were arrested for corruption, resulting in massive reputation damage and legal costs. The regulatory pressure did not fully recover, and in 2021 during COVID, the government increased intensity when cracking down on all health insurers.
Map of South America showing regulatory challenges in Brazil, Chile, and Colombia with flags and risk levels.
IMPLICATIONS FOR INVESTMENT IN EMERGING MARKETS
Global capital is becoming more selective due to:
Higher global interest rates.
Reduced tolerance for political and regulatory risk.
Increased focus on liquidity and exit flexibility.
This has resulted in investors prioritizing:
Asset-light models.
Clear exit paths.
Local partnerships.
Revenue diversification across markets.
Lower exposure to political decision-making.
Why local investment is increasing for Local and regional investors:
Better understand regulatory environments.
Face lower currency mismatch.
Have stronger political and institutional relationships.
Are more willing to accept long-term, moderate returns
HARD VS SOFT CAPITAL: THE NEW HEALTHCARE INVESTMENT PARADIGM
UnitedHealth Group’s model
UnitedHealth Group bet on physical hospitals, insurance balance sheets, and local currency. This is hard capitalwhich is illiquid, politically visible, slow to exit and margin-sensitive.
A chart showing UHG $8B capital loss with investment, asset sales, net destruction, and write-downs
Based on UnitedHealth Group's disclosed $7.7B in total South American investments(cumulative investment in Amil (Brazil, 2012) and Banmédica (Chile, 2018)) and estimated total sale proceeds of approximately $2.8B, the company recovered only about 36% of its initial capital. This calculation aligns with the estimated 8 billion in cumulative write-downs UHG reported on these assets in its SEC filings( UHG NEWSROOM(AMIL), UHG bancmedica).
By contrast, telemedicine and AI startups operate on asset-light platforms, software & data, making regional scalability and exits through acquisitions, shutdowns, and pivots easier.
This is soft capital. It is mobile, modular, easier to scale down or up, and less exposed to regulators initially.
STRATEGIC GUIDE: HOW TO INVEST IN EMERGING MARKET HEALTHCARE POST-UNITEDHEALTH GROUP
For multinational healthcare firms
Avoid full vertical integration in emerging markets.
Use partnerships or minority stakes.
Price political and currency risk explicitly.
Align operating models with local systems.
For policymakers
Improve regulatory clarity and predictability.
Encourage responsible foreign participation without excessive complexity.
Support digital and preventative healthcare innovation.
For investors
Favor hybrid models combining local ownership with global expertise.
Focus on digital health, telemedicine, and insurtech.
Treat healthcare as a long-term social investment, not a rapid-return asset.
Strategic pyramid of emerging market investment playbook showing asset-light models, partnerships, and regulatory risk pricing.
Bottom Line
UnitedHealth Group’s exit from South America marks a turning point in global healthcare investment strategy. It illustrates the limits of exporting large-scale, U.S. Healthcare models into emerging markets and reinforces the growing importance of local capital, adaptive strategies and flexible investment structures.
FAQ’s: UnitedHealth Group Failure in South America
1. Why did UnitedHealth Group fail in South America
UHG’s capital-heavy, vertically integrated U.S. healthcare model conflicted with regulations, political oversight, currency volatility, and lower-margin emerging market healthcare systems.
2. How much did UnitedHealth Group lose in South America?
UHG incurred over $8 billion in losses, recovering only an estimated 36% of invested capital after divesting its South American operations.
3. When did UnitedHealth Group exit South America?
The phased exit began in late 2022 and was completed in 2025 with the sale of Banmédica in Chile and Colombia.
4. Why did other global insurers succeed?
They used asset-light, partnership-based strategies, reducing capital intensity, regulatory exposure, and political risk.
5.What does this exit mean for emerging market healthcare investment?
It signals a shift toward local partnerships, flexible investment structures, and digital-first healthcare solutions.
Renewable Energy, Green Financing, and Market Impact in South America
Executive Summary
South America is rapidly emerging as one of the world’s fastest-growing data center markets. Once overshadowed by established global hubs such as Frankfurt, Northern Virginia, and Singapore, the region is now attracting large-scale investment driven by cloud adoption, hyperscaler expansion, regulatory localization, and abundant renewable energy.
The South American data center market is projected to grow from USD 3.78 billion in 2025 to USD 6.42 billion by 2030, representing a compound annual growth rate (CAGR) of 11.18% (Mordor Intelligence, 2025).
IT load capacity is expected to expand from 1.51 GW to 2.23 GW over the same period, reflecting rising demand from hyperscale cloud platforms, AI workloads, and 5G-enabled edge computing.
Brazil and Chile anchor the region’s growth. Brazil leads in scale and capacity, while Chile has positioned itself as the region’s sustainability-focused hub, attracting ESG-driven hyperscaler investment.
Together, these markets illustrate how renewable energy availability, green financing, and regulatory clarity are shaping South America’s data infrastructure landscape.
South America's renewable energy growth, green financing, and data center market impact, highlighting Brazil and Chile’s energy mix, ESG investment trends, cloud demand, and internet expansion.
The Forces Driving South America’s Data Centre Growth
The surge is driven by concurrent trends that have created unprecedented demand for local data infrastructure.
Connected Population: With an estimated 345 million internet users in South America as of October 2025 anda young population, the continent offers great potential for digital services (ITU Internet Use Statistics , World Population Review 2025). Colombia’s creative industries and São Paulo’s fintech are driving demand for low-latency data services.
Subsea Cable Expansion: South America’s digital links to the world are strengthening. High-capacity subsea cables such as Humboldt, Firmina, and Malbec now connect the region to global data routes.
Cities such as Chile, Brazil, and Argentina are the landing points. They are turning into key network hubs that enable faster connections and support the growth of data centres.
Data Sovereignty Regulations: Regulation is now a growth driver. Modeled on Europe’s GDPR, Brazil’s Lei Geral de Proteção de Dados (LGPD) enforces data protection and localisation rules. Similar laws are being set in other South American Countries, forcing businesses to host and process user data locally, driving strong demand for regional data centers.
Post-Pandemic Digital Economy: The COVID-19 pandemic altered the digital landscape. There was a 30% increase in internet usage in Latin America, boosting remote work, e-commerce, and fintech growth (World Bank). This shift has created a demand for stronger local computing power.
Hyperscalers Race for Cloud Market Dominance: Competition among major cloud providers, AWS, Google Cloud, and Microsoft Azure, is fueling infrastructure growth.
These cloud providers are the largest consumers of capacity. They are expanding regional networks that meet enterprise needs. Microsoft’s $3.1 billion investment in Cloud and AI highlights the scale of this shift.
Key Markets: Brazil, Chile, and Emerging Hubs Brazil: Scale and Renewable Advantage
Brazil is also the region’s renewable energy leader. Around 89% of its electricity comes from renewables, largely hydropower, supported by fast-growing wind and solar capacity. This gives Brazil a structural advantage in powering large-scale data infrastructure with low-carbon electricity.
Brazil accounts for approximately 40% of Latin America’s data centre capacity. São Paulo ranks among the world’s top emerging data centre markets. The country’s scale, dense fibre networks, and steady enterprise demand keep it in a leadership position. Demand comes from both traditional enterprise clients and fast-growing AI and IoT workloads.
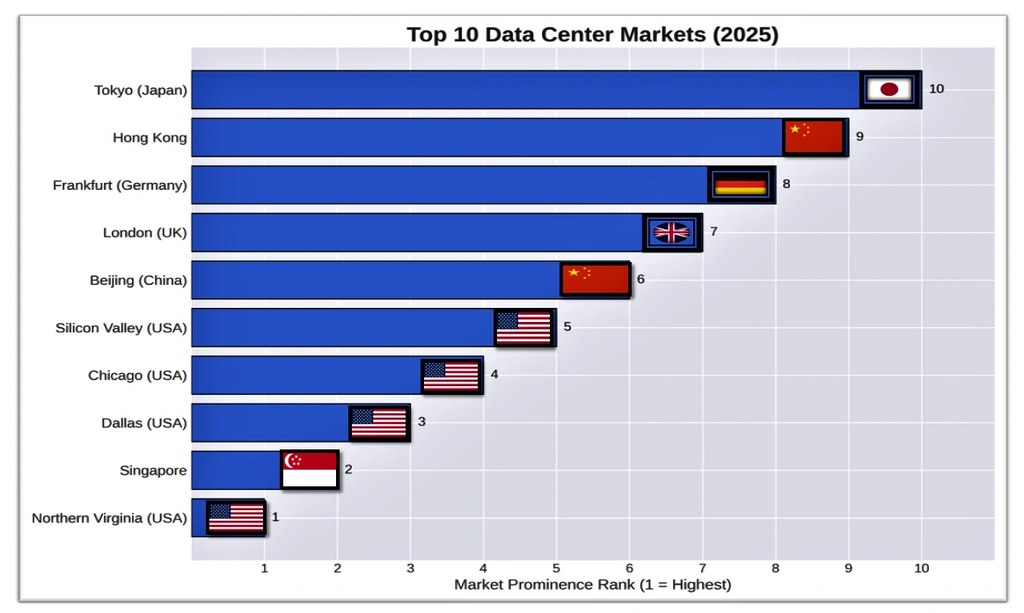
Top 10 Global Data Center Markets 2025 ranked by prominence with country flags – Northern Virginia, Singapore, Dallas, Chicago, Silicon Valley, Beijing, London, Frankfurt, Hong Kong, Tokyo. Source: Abramwireless
Prominence indicates how influencial, important and dominant a data center market is globally.
Key Indicators of Prominence
Total capacity (MW): How much IT load the market can support.
Hyperscale presence: Number of major cloud providers (like AWS, Azure, Google Cloud).
Connectivity: Access to fiber networks, internet exchanges, and latency performance.
Investment volume: Real estate, infrastructure, and energy investments.
Strategic location: Proximity to financial hubs, population centers, or geopolitical importance.
Regulatory and sustainability leadership: Compliance with data laws and green energy adoption.
Takeaway: The graph highlights that while the U.S. remains dominant, Asia-Pacific and Europe are catching up fast, driven by AI adoption, sovereign data laws, and sustainability mandates.
Chile: The Sustainability-Focused Hub Chile has positioned itself as the region’s sustainability-focused data centre hub. In 2024, renewables supplied about 70% of Chile’s electricity, driven mainly by rapid growth in solar and wind. While this share is lower than Brazil’s hydro-led mix, Chile’s energy transition is among the fastest in Latin America.
Chile is the first Latin American country to legally commit tocarbon neutrality by 2050. It is phasing out coal generation by 2040 and has issued green bonds while enforcing a national CO₂ tax to accelerate clean energy investment.
These policies, combined with political stability, make the country highly attractive to hyperscalers with Environmental, Social, and Governance mandates.
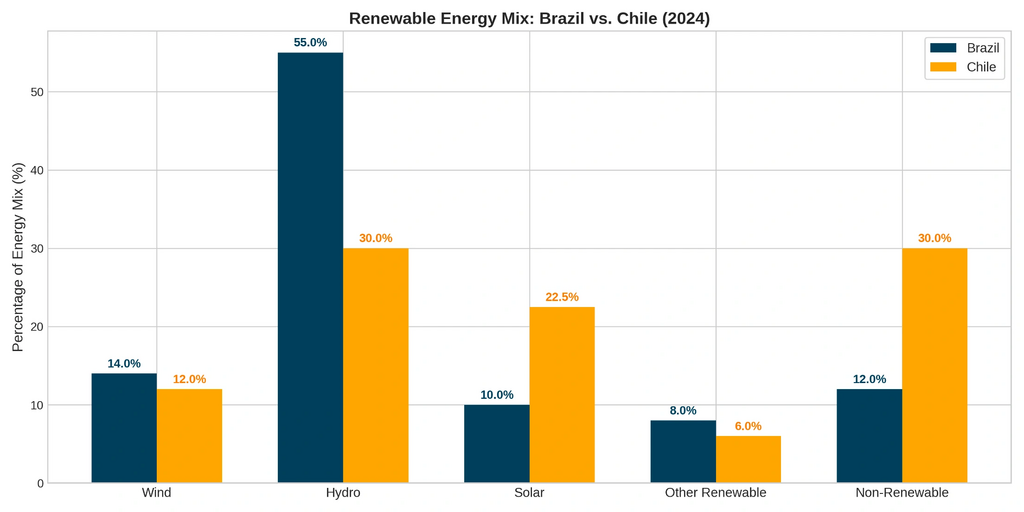
Brazil vs Chile renewable energy mix 2024 bar chart comparing hydro, wind, solar, other renewables, and non-renewable sources
Key Insights from the Renewable Brazil's and Chile's Energy Mix
Brazil's grid is powered primarily by hydropower (55%), giving it a stable, low-carbon foundation for data center growth, though with some climate vulnerability.
Chile leads in solar penetration (22.5% vs Brazil's 10%), reflecting its aggressive energy transition and making it ideal for sustainable data operations aligned with corporate ESG goals.
Brazil's higher overall renewable percentage (89% vs 70%) provides an immediate carbon advantage, while Chile's diversified mix signals faster transition momentum, with both countries offering strong green power propositions for data center operators.
Implications: High renewable penetration lowers operating costs and carbon intensity, positioning South America favorably against fossil fuel-dependent digital infrastructure regions.
Emerging South American Data Center Markets Beyond Brazil and Chile, several countries are rapidly expanding their data center presence due to digital growth, supportive policies, and rising demand for cloud and AI infrastructure:
Colombia: Experiencing strong growth, attracting major AI infrastructure investments backed by national strategies.
Peru: Smaller in capacity but actively participating in regional expansion.
Panama: Developing as a digital hub, seeing increasing data center investment alongside Costa Rica and Peru.
Argentina: Drawing investment with energy opportunities from resources like the Vaca Muerta shale play.
Uruguay: Leveraging renewable energy to support sustainable data center development.
ESG Leadership and Global Operators
Global data center and cloud operators are reinforcing ESG leadership across the South American region:
Equinix sources 96% renewable energy globally and targets climate neutrality by 2030 through PPAs and advanced cooling systems.
Google has matched 100% of its electricity consumption with renewables since 2017 and is pursuing 24/7 carbon-free energy by 2030, with average data center PUE of 1.09.
Microsoft aims to be carbon negative by 2030, deploying waste-heat recovery and circular hardware reuse strategies. Its decision to establish a major Azure region in Chile underscores the country’s growing role as South America’s green data center hub.
Brazil remains the regional hub, with major investments in São Paulo, while Chile is emerging as a sustainability-focused destination due to its fast-growing wind and solar capacity.
Hyperscalers like AWS, Google, and Microsoft set the standard for ESG alignment, encouraging local operators to adopt global sustainability practices.
Green financing, advanced cooling technologies, and strategic renewable energy agreements are key trends driving growth and ensuring that South America’s data center market expands responsibly and sustainably.
The Market Players
There are three tiers of players that pose competition, which pushes the market to grow and innovate faster.
Global Colocation Giants: Companies such as Digital Realty, Equinix, and EdgeConnex form South America’s digital infrastructure backbone. These global colocation giants operate interconnected hubs that support enterprises and small cloud providers to ensure strong network resilience and connectivity.
The Hyperscalers: AWS, Microsoft Azure, and Google Cloud are considered to be the demand drivers. Their capital expenditure on large data centers defines scale and expansion across the region.
Regional Champions: Regional companies such as KIO Networks, Elea Digital, and ODATA drive growth through local insight. Their local expertise on regional markets helps them secure land, permits, and power faster than global competitors.
The Role of Green Financing
The growth of sustainable data centers is being catalyzed by specialized financing. Green bonds, sustainability-linked loans (SLLs), and financing from development banks (e.g., IFC, IDB Invest) are becoming critical tools. These instruments tie funding to ESG performance targets, such as achieving a specific Power Usage Effectiveness (PUE) or renewable energy percentage.
Regional operators like Scala and ODATA have successfully tapped these markets to fund expansions, demonstrating how global ESG capital flows are directly enabling South America's infrastructure build-out.
Challenges Ahead
The data center market’s rapid growth in South America has exposed structural and operational challenges that need to be considered.
Geopolitical and Economic Volatility: Brazil’s currency, the Brazilian real (BRL), is a characteristically volatile emerging market currency, sensitive to global commodity prices and domestic politics.
This inherent volatility exposes businesses to substantial FX risk, with direct implications for capex costs, power contracts, and foreign debt exposure. In 2024, the BRL lost more than 20% of its value against the USD, before appreciating roughly 13% year-to-date in 2025 due to high domestic interest rates and a weaker US dollar.
Power and Water Scarcity: In South America, Brazil, Chile, and Colombia are driving data center growth while prioritizing sustainability. Brazil hosts major operators like Scala Data Centers and ODATA, which integrate 100% renewable energy and liquid cooling to support AI workloads.
Chile is expanding its green data center regions, leveraging wind and solar energy. Colombia is rapidly scaling its infrastructure with a focus on renewables.
Talent and Supply Chain: Shortages of skilled technical workers and constrained supply of critical equipment, such as switchgear and generators, continue to slow expansion. In early 2024, Brazil delayed about 5.39 GW of planned power generation capacity, according to the National Electric Energy Agency (ANEEL).
Delays affected solar (2.64 GW), wind (1.95 GW), biomass (412 MW), and other projects. Causes included construction issues, licensing delays, grid access bottlenecks, PPA challenges, and regulatory uncertainty.
Outlook: Distributed, AI-Ready, and Sustainable
The next phase of growth is shifting away from centralized hyperscale facilities toward more distributed infrastructure.
Sustainability as a License to Operate: 24/7 carbon-free energy sourcing and green building standards will evolve from a market differentiator to a basic requirement for new data center projects that are driven by both future regulations and corporate ESG.
The Edge Computing Wave: Real-time applications such as telemedicine, autonomous mining, and smart cities will drive the rise of smaller edge data centers in secondary cities, positioning computing power close to users for lower latency and faster processing.
AI-Ready Infrastructure: The global AI surge will require a new generation of data centers in South America. These facilities will be equipped with high-power density and direct liquid cooling to support AI training workloads. Forward-thinking developers will gain a strong competitive edge.
Building South America’s Digital Foundation
South America’s data boom is more than infrastructure growth; it's the continent's foundational bedrock for its own digital independence. Investing billions in local computing capacity will reduce its reliance on foreign infrastructure, which will foster local innovation and strengthen global competitiveness. With every new data center, South America’s data infrastructure grows more resilient, faster, and stronger.
Implications for Stakeholders
1. Policymakers: Develop clear regulatory frameworks that encourage sustainable data center growth. Offer incentives such as tax breaks and renewable energy subsidies, while ensuring data sovereignty policies balance privacy with investment appeal.
Support workforce development through technical education and training programs to build local expertise for operating advanced AI and cloud infrastructure. Facilitate streamlined permitting and licensing to reduce project delays and attract both domestic and international investors.
2. Corporations and Data Center Operators: Focus on integrating renewable energy through Power Purchase Agreements (PPAs) and local green energy partnerships. Implement advanced cooling technologies, including liquid immersion systems, to increase efficiency and reduce water usage.
Align ESG strategies with international standards such as LEED and ISO 50001 to attract hyperscaler clients and investors. Expand AI-ready infrastructure with scalable, high-density power solutions to meet growing demand from cloud and edge computing applications.
3. Technology and Cloud Companies: Lead the market in carbon neutrality, renewable energy adoption, and resource efficiency to influence local operators and policy frameworks. Partner with governments and regional operators to develop resilient, distributed infrastructure that reduces latency and strengthens digital independence.
Invest in edge computing, AI-ready data centers, and initiatives supporting data sovereignty to meet the demands of fintech, telemedicine, smart cities, and other emerging digital applications.
Key Takeaways
South America is the fastest-growing data center market in 2025, fueled by cloud demand, AI, and post-pandemic digitalization.
Brazil leads in capacity; Chile leads in sustainability. Emerging markets like Colombia, Peru, Panama, Argentina, and Uruguay are rapidly expanding.
Renewable energy and advanced cooling are central to sustainable growth.
The market faces challenges in economics, resources, and talent.
Growth will focus on distributed, AI-ready, and edge infrastructure.
Collaboration between governments, corporates, and tech companies is key to resilient, inclusive digital development.
Frequently Asked Questions
1. Why is South America the fastest-growing data center market?
South America is growing fastest due to cloud and AI demand, data-localization laws, subsea cables, and abundant renewable energy.
2. Which South American country is best for hyperscale data centers?
Brazil leads in scale and connectivity, while Chile leads in renewable energy, ESG policy, and sustainability-focused hyperscale deployments.
3. How important is renewable energy for data centers in South America?
Renewables are critical: Brazil runs on an estiamated 89% clean energy and Chile 70% estimate, lowering costs, emissions, and ESG risk for hyperscalers.
4 . Are hyperscalers investing in South America?
Yes. AWS, Google, and Microsoft are investing billions in South America to support cloud, AI, data sovereignty, and low-carbon operations.
5. What challenges affect data center expansion in South America?
Key risks include power and water constraints, FX volatility, talent shortages, and grid connection delays despite strong demand.
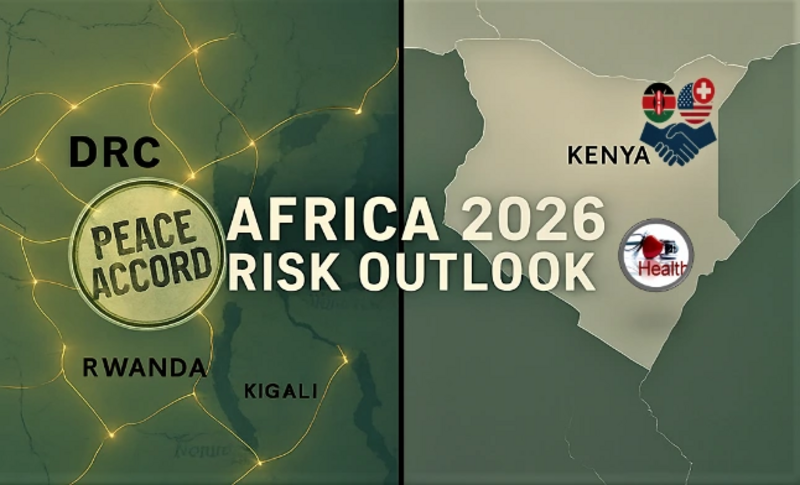
Executive Summary Africa’s 2026 growth and risk landscape is being reshaped by high-stakes agreements and regional macro developments. The Washington Accords between the DRC and Rwanda aim to de-escalate conflict in eastern Congo, while Kenya’s Health Cooperation Framework with the US seeks to strengthen state-led healthcare financing.
Across the continent, additional factors, including Nigeria’s fiscal reforms, South Africa’s energy crisis, and East African infrastructure challenges, create a complex mix of opportunity and execution risk.
Key takeaway:
Investment, trade, and insurance outcomes in Africa in 2026 will depend more on implementation, governance, and enforcement than on policy announcements.
What Is the DRC–Rwanda Peace Deal (Washington Accords)?
What was signed, and why it matters
The DRC–Rwanda peace deal, commonly referred to as the Washington Accords, is a US-facilitated agreement signed in 2025 to reduce hostilities in eastern Democratic Republic of the Congo. The accord emphasizes sovereignty, non-interference, ceasefire adherence, and political dialogue, with the stated goal of enabling regional trade, investment, and humanitarian access.
The United Nations views the agreement as a “critical step,” while cautioning that hostilities persist near border areas, underscoring the fragility of implementation (UN, 2025).
Post-signing reporting pointed to fresh clashes and public accusations of violations, signalling that enforcement, verification, and third-party monitoring are the accord’s immediate tests.
Political and security context
US officials framed the agreement as part of a broader pivot toward commerce-led engagement in Africa, linking peace to investment, trade corridors, and supply-chain resilience. However, parallel mediation tracks and the presence of non-signatory armed groups complicate the transition from diplomatic text to durable security on the ground. Early reactions suggest deterrence remains uneven and confidence highly conditional.
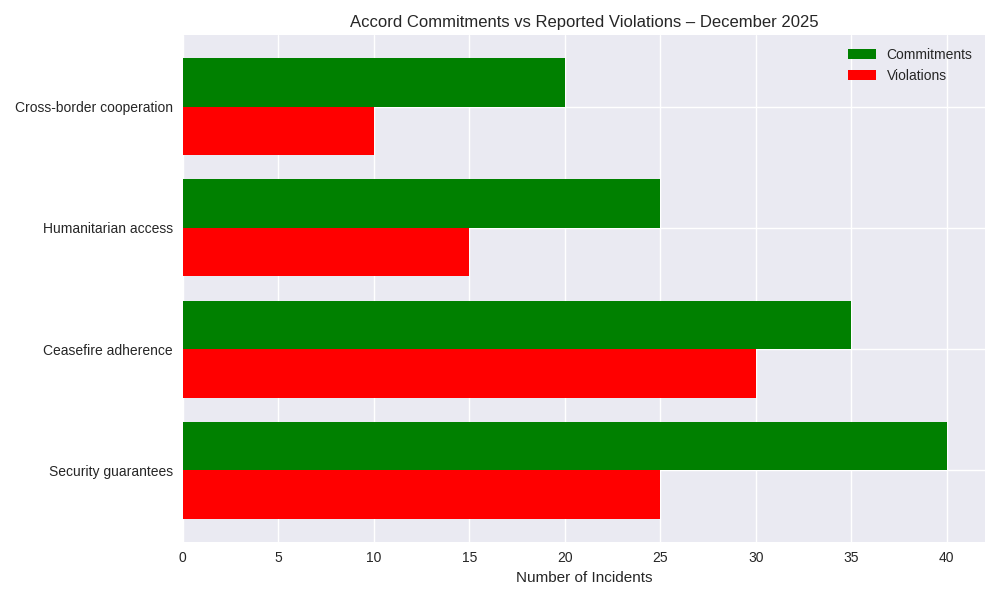
Peace accord commitments vs violations chart with North Kivu conflict nodes and de‑escalation corridor map.
Key insight: The visual shows that while commitments under the Washington Accords were substantial whereby violations remained high, especially in ceasefire adherence, highlighting fragile enforcement. Conflict nodes in North Kivu overlap with humanitarian corridors, meaning instability directly threatens aid delivery and regional trade.
Bar chart of DRC–Rwanda peace accord commitments vs violations across security, ceasefire, humanitarian, and cross‑border cooperation.
Major Insights from the Graph
Security guarantees vs. violations: Commitments (40) outpaced violations (25), suggesting partial compliance. Yet the gap is narrower than expected, showing enforcement challenges.
Ceasefire adherence: Violations (30) nearly matched commitments (35), indicating the ceasefire is the weakest pillar of the accord. This undermines confidence in DDR (disarmament, demobilization, reintegration) programs.
Humanitarian access: Commitments (25) were higher than violations (15), showing relatively better compliance. Still, violations here directly impact aid delivery to civilians.
Cross-border cooperation: Lowest commitments (20) and violations (10), reflecting limited progress but also fewer flashpoints compared to internal ceasefire issues.
Implications
Fragile peace: High violation rates in ceasefire adherence suggest relapse risk. Without stronger monitoring, the accord may fail to stabilize eastern DRC.
Humanitarian risk: Aid corridors intersect with conflict zones, raising insurance premiums and deterring NGOs from scaling operations.
Business impact: Mineral supply chains (cobalt, 3T minerals) remain vulnerable to disruption. Firms will need conflict-sensitive sourcing and diversified logistics.
Policy challenge: Enforcement gaps demand third-party monitoring (UN, AU) and incentives for compliance. Without this, commerce-led engagement will stall.
Key takeaway: The visual confirms that while commitments are ambitious, violations remain too high to guarantee stability. For businesses and policymakers, this means planning for volatility, embedding resilience in supply chains, and pressing for stronger enforcement mechanisms.
What Is the Kenya–US Health Cooperation Framework (2026–2031)?
Scope and funding
Kenya and the US signed a five-year, KSh208 billion health cooperation framework designed to shift aid from NGOs to state institutions, accelerate domestic financing, and align donor support with national reforms. The Ministry of Health published the full 37-page agreement, highlighting compliance with Kenya’s Data Protection Act (2019) and Digital Health Act (2023).
Legal challenges and sectoral allocations
Kenyan courts subsequently issued conservatory orders temporarily suspending implementation, pending petitions on data privacy, ratification procedures, and public participation. This has introduced uncertainty for procurement timelines and program rollout under Universal Health Coverage initiatives.
Preliminary allocation disclosures indicate HIV services will receive the largest funding share in 2026, with planned increases in domestic financing through 2031, placing heightened scrutiny on fiscal controls and delivery capacity.
Kenya–US Health Deal Allocations by Category (2026-2031)
Kenya–US health funding allocations 2026–2031 chart showing HIV services, lab systems, and treatment commodities growth.
Key insights from Kenya–US Health Allocations 2026–2031:
Funding Trends
Overall Growth: Total U.S. health allocations to Kenya steadily increase year by year from 2026 to 2031.
HIV Services (Blue): Largest share of funding across all years, reflecting continued prioritization of HIV response.
Laboratory Systems (Orange): Moderate but steady growth, highlighting emphasis on strengthening diagnostic infrastructure.
Treatment Commodities (Green): Noticeable increase over time, suggesting scaling up of essential medicines and supplies.
Strategic Implications
Shift Toward Systems Strengthening: The rising allocations for lab systems and commodities show a pivot from aid dependency toward building Kenya’s health system capacity.
Universal Health Coverage (UHC) Support: The funding aligns with Kenya’s UHC goals, ensuring broader access to treatment and diagnostics.
Partnership Stability: The consistent upward trend signals long-term U.S. commitment to Kenya’s health sector.
Risk Assessment and Scenarios for Kenya and DRC- Rwanda in 2026
Congo - Rwanda accord
Fragility risk: Continued hostilities and violation claims could trigger localized escalation and erode confidence in DDR and monitoring mechanisms.
Enforcement gap: Non-signatory militias, contested control zones, and limited verification capacity elevate relapse risk without credible third-party oversight.
Political volatility: Commerce-first messaging is constructive but vulnerable to security reversals, electoral pressures, and cross-border tensions.
Kenya - US health deal
Legal and governance risk: Court suspensions cloud timelines for data transfers, procurement, and disbursements, affecting vendors and implementers.
Data protection risk: Despite statutory assurances, cross-border data use remains a reputational and compliance exposure without DPIAs, localization options, and regulator clarity.
Operational risk: Redirecting funds to state systems requires strong fiscal controls, supply-chain integrity, and performance monitoring, especially for high-visibility HIV programs.
Regional Context Beyond Core Deals
Africa’s 2026 outlook is shaped not only by high-profile agreements but also by macro, energy, and fiscal dynamics across key regions.
West Africa: Nigeria
Fiscal Reforms: Removal of fuel subsidies, exchange-rate unification, and higher revenue collection.
Risks: Inflation, FX volatility, and social resistance.
Implications: Market-sensitive reforms create opportunity but with execution risk. Regional spillovers affect ECOWAS trade and remittances.
Southern Africa: South Africa
Energy Crisis: Load shedding persists, private generation grows, but transmission bottlenecks remain.
Implications: Industrial production, supply chains, and insurance costs are impacted; investment is bifurcated toward self-sufficient firms.
East Africa (Beyond Kenya)
Trends: Infrastructure-led growth continues in Ethiopia and Tanzania but is debt-sensitive.
Implications: Procurement delays, FX shortages, and fiscal constraints create selective investment opportunities.
North Africa
Egypt and Morocco: Relative political stability but exposed to external financing pressures and climate stress.
Implications: Lower security risk but macro sensitivity is elevated, requiring careful investor monitoring.
Africa 2026 regional risk scorecards with investment impact and risk ratings
Legend:
1 = Low risk / high execution capacity 5 = High risk / fragile execution
Economic and Business Impact: What Africa’s 2026 Deals Mean for Trade, Investment, and Risk
Supply chains and commodities
Great Lakes minerals: Sustained peace could stabilize cobalt and 3T mineral logistics; renewed violence would raise insurance premiums, security surcharges, and route-diversion costs.
Compliance exposure: Firms operating in eastern DRC face elevated due-diligence requirements tied to conflict-sensitive sourcing and beneficiary vetting.
Health markets and procurement
Market restructuring: Kenya’s shift to state-led financing reshapes supplier relationships and may reduce NGO-led channels, affecting payment cycles and audit regimes.
Data services: Health-tech and informatics providers must align with national data laws; cross-border analytics will require enhanced contractual and regulatory safeguards.
Finance and insurance
Risk pricing: Underwriters will track DDR progress, border incidents, and court rulings in real time, directly influencing premiums for logistics, health procurement, and PPPs.
The Stakes Ahead
2026 is a decisive year for Africa’s risk and investment trajectory. If governments can translate peace accords, fiscal reforms, health financing shifts, and energy policies into credible enforcement and delivery, the payoff will be lower risk premiums, more stable supply chains, and longer-term capital commitment.
If execution falters,through renewed conflict in eastern DRC, prolonged legal uncertainty in Kenya, reform fatigue in Nigeria, or persistent energy failures in South Africa, the result will be higher insurance costs, delayed investment, and a reversion to short-term, risk-averse capital.
The outcome will be determined not by ambition or diplomacy, but by follow-through at courts, checkpoints, grids, and public institutions.
What Investors Need to Know
1.Execution risk dominates the investment case Peace accords (DRC–Rwanda), health financing reforms (Kenya), fiscal adjustments (Nigeria), and energy reforms (South Africa) are all directionally positive. However, weak enforcement, court interventions, infrastructure bottlenecks, and political pushback create volatility across sectors.
2. Risk is uneven and increasingly priced in real time
Eastern DRC and South Africa remain high-risk operating environments due to security and energy constraints. Kenya and Nigeria present medium-high risk, where reforms are credible but legally and politically exposed. North Africa offers lower security risk but higher macro and external financing sensitivity.
3.Supply chains and cash flow are the primary pressure points
Minerals (cobalt, 3T) face disruption from insecurity and insurance repricing. Health procurement and digital services face delays, compliance costs, and data governance exposure. Energy unreliability and FX volatility directly affect margins, timelines, and financing costs.
4. Resilience is now a competitive advantage
Investors with diversified logistics, flexible contracts, localized data strategies, and strong compliance systems will outperform. Passive exposure to “Africa growth” narratives without mitigation will underperform.
Investor takeaway: Africa remains investable in 2026, but only selectively, with active risk management and jurisdiction-specific strategies.
What Policymakers Need to Know
1.Agreements without enforcement erode trust
The DRC–Rwanda accord risks losing credibility without independent monitoring and consequences for violations. Kenya’s health reform agenda faces reputational risk if legal and data governance issues are not resolved transparently.
2.Legal clarity is now a macro-stability issue
Court suspensions, regulatory ambiguity, and opaque ratification processes delay investment and raise sovereign risk premiums. Predictable legal pathways are as important as fiscal or security reforms.
3.State capacity is the binding constraint
Shifting financing to government systems (Kenya, Nigeria) increases ownership but also exposes weaknesses in procurement, fiscal controls, and service delivery. Energy and infrastructure failures (South Africa) impose economy-wide costs.
4.Investor confidence is conditional
Markets reward reform intent only when paired with verifiable implementation milestones. Poor execution now results in higher insurance premiums, delayed financing, and reduced policy space later.
Policy takeaway: In 2026, credibility is earned operationally, through enforcement, institutions, and transparency not diplomatically.
Strategic Takeaway: What This Means for Africa’s 2026 Risk and Investment Outlook
Execution over agreements: Implementation determines real outcomes.
Embed resilience: Conflict-sensitive sourcing, flexible contracts, and contingency planning are essential.
Monitor real-time indicators: Security incidents, court rulings, FX, and energy metrics.
Calibrate regionally: Nigeria (fiscal), South Africa (energy), East Africa (procurement), North Africa (macro).
Opportunity is conditional: Governance, institutional capacity, and enforcement drive returns.
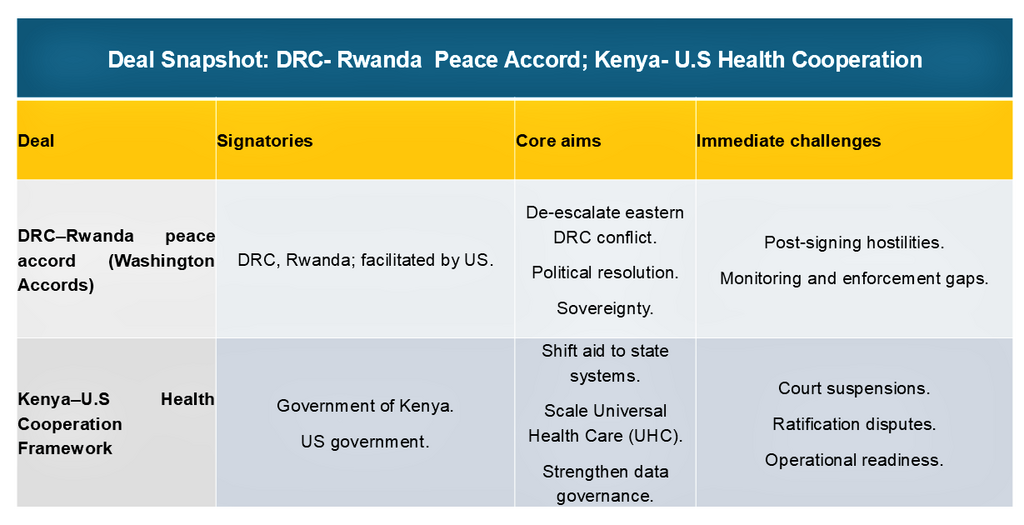
Deal snapshots
DRC–Rwanda peace accord vs Kenya–US health cooperation table with aims and challenges.
Frequently Asked Questions (FAQs)
1: What is the DRC–Rwanda peace deal’s significance for 2026?
Reduces eastern DRC conflict, but fragile enforcement maintains high DDR and supply-chain risk.
2: How does Kenya’s health deal affect businesses?
Procurement channels shift; compliance burdens increase; timelines are uncertain.
3: What should investors monitor in Africa 2026?
Ceasefire compliance, DDR progress, court rulings, FX, energy reliability, and regulatory clarity.
4: Which countries present the highest operational risk in 2026?
DRC/Rwanda and South Africa (risk score 5), followed by Kenya and Nigeria (risk score 4).
An analysis of the immediate failures, the looming gun law reforms, and the Australia's confrontation with rising antisemitism.
On December 14, 2025, Australia was shaken by a mass shooting at Sydney’s Bondi Beach during a Hanukkah celebration. Two gunmen, Sajid Akram (50) and his son Naveed Akram (24), opened fire on a crowd of nearly 1,000 people, leaving 15 dead and more than 40 injured (USA today). This marked the worst mass shooting in Australia since 1996 and triggered nationwide debates on antisemitism, counterterrorism, and gun control.
Bondi Beach Massacre 2025: Security Crisis and Terrorism Analysis
The gunmen opened fire from an overpass while shouting extremist slogans. One of the attackers was killed by police, while the other was critically injured.
Among the victims were children and the elderly, with vigils held at Bondi Pavilion to honor the lives lost.
Australian Government Response to Bondi Beach Shooting
Prime Minister Anthony Albanese condemned the attack as an “act of evil antisemitism, terrorism.” Over 300 police officers were deployed to Sydney, and urgent discussions on tougher gun laws have been initiated.
The attack has also intensified national conversations about rising antisemitism in Australia, particularly amid recent extremist rhetoric and hate crimes.
Bar chart comparing fatalities and injuries in major Australian mass shootings from Port Arthur, Monash and Bondi Beach (1996 - 2025).
Key Insights from the graph:
Port Arthur Remains the Deadliest: The 1996 Port Arthur massacre remains the deadliest incident shown, with 35 fatalities. It is the only event on the chart where the number of deaths exceeds the number of injuries.
Bondi Beach (2025) Recorded the Highest Injuries: While it had fewer fatalities than Port Arthur, the 2025 Bondi Beach incident resulted in the highest number of injuries recorded among these major events (40 injuries).
Significant Total Casualty Comparison: The 2025 Bondi Beach incident is the most significant mass casualty event in this comparison since 1996.
Long Intervals Between Major Events: The chart illustrates a significant 23-year gap between the 2002 Monash University shooting and the 2025 Bondi Beach incident, highlighting that such large-scale "major" incidents have historically been rare in Australia.
Scale of the Monash Incident: Compared to the other two, the 2002 Monash incident was much smaller in scale, resulting in 7 total casualties (2 deaths, 5 injuries), making it a significant but much lower-impact outlier on this specific list of major shootings.
The Bondi Beach shooting is now considered the deadliest mass shooting in Australia in nearly three decades.
Trends in Australian Mass Shootings
Over time, Australian mass shootings have shown a shift toward higher injury counts relative to fatalities, potentially reflecting changing attack tactics.
Antisemitism is on the rise nationwide, and this attack has renewed calls for stronger measures to combat hate crimes and extremist violence.
Bar chart ranking Global Antisemitic Attitude Index 2025: Kuwait & West Bank Gaza highest at 97%, Indonesia 96%, global average 46%, lowest Sweden 5%.
Key Takeaways From Global Antisematic Attitude Index Chart
Highest Index Levels:The top of the list is dominated by the Middle East and North Africa (MENA) region, with the West Bank & Gaza, Kuwait, and Indonesia recording levels above 95%.
Global Benchmark: Australia’s score of 20% is significantly lower than the Global Average (46%), but it remains more than double that of other Western nations like the UK (9%), USA (9%), and Sweden (5%).
Australia's Trajectory:While Australia ranks relatively low in terms of general population attitudes compared to the global scale, the 317% increase in reported incidents over the last year (following events like the 2025 Bondi Beach tragedy) indicates a sharp rise in active extremism despite a lower general index score
Global Context: How Australia Compares Internationally
Mass Shooting Frequency Comparison:
Australia: 1 major event per decade (average since Port Arthur).
United States: 600+ mass shootings annually (2020-2024 average).
Canada: 2-3 significant events per decade.
United Kingdom: 1 major event every 15 years.
New Zealand: Christchurch 2019 prompted major reforms.
Policy Response Comparison:
Australia (1996): Rapid, comprehensive reform post-Port Arthur.
New Zealand (2019): 72-hour response with firearm buyback.
United Kingdom (1996): Strict handgun bans after Dunblane.
Canada (2020): Assault weapon ban after Nova Scotia attacks.
United States: Incremental state-level changes, no federal consensus.
Economic and Social Impact of the Bondi Beach Massacre
1. National Security and Counterterrorism Concerns. The massacre has reignited debates over gun laws, antisemitism, and counterterrorism (ABC News). Australia may face heightened scrutiny of its security framework and pressure to tighten firearms regulation.
2. Social Impact and Public Fear. The attack has heightened fear among Sydney residents and businesses, increased reputational risk, and intensified concerns within Jewish communities nationwide.
3. Consumer Confidence and Economic Sentiment. Consumer sentiment fell by 9% in December 2025, driven by inflation concerns and compounded by security fears following the Bondi Beach attack.
Policy Recommendations: Preventing Future Attacks
Immediate Actions (0-6 Months):
National Security Review: Independent inquiry into intelligence failures.
Firearm Registry Overhaul: Real-time tracking system implementation.
Public Event Guidelines: Mandatory security assessments for gatherings >500 people.
Hate Crime Legislation: Strengthened penalties and reporting requirements.
Medium-Term Reforms (6-24 Months):
Community Policing Expansion: 500 additional officers for community engagement.
Mental Health Integration: Mandatory reporting to firearm registries.
Education Curriculum: National program on extremism prevention.
International Cooperation: Enhanced intelligence sharing with Five Eyes partners.
Long-Term Strategy (2-5 Years):
Technology Investment: AI monitoring of online extremist content.
Social Cohesion Programs: $100 million annual funding for community integration.
Research Institute: Australian Centre for Extremism Studies establishment.
Legislative Review: Comprehensive review of all counter-terrorism laws.
The Road Ahead After the Bondi Beach Shooting: Australia's Security Crossroads
The Bondi Beach Massacre of 2025 represents a critical inflection point for Australian security policy, social cohesion, and counter-terrorism strategy. The attack exposes vulnerabilities in intelligence sharing, public event security, and online radicalization monitoring.
Three critical lessons emerge:
Intelligence Reform Needed: Australia's security apparatus must adapt to evolving domestic extremism threats beyond traditional categories.
Firearm Regulation Gaps: The 1996 Port Arthur reforms require updating for digital age challenges including online sales and weapon modification.
Social Cohesion Investment: Addressing root causes of radicalization requires sustained investment in community integration and counter-extremism education.
Bottom Line
The response to the Bondi Beach Shooting issue will test Australia's ability to balance security imperatives with civil liberties, rapid response with thoughtful reform, and immediate trauma with long-term healing. The decisions made in 2025-2026 will shape Australian security policy for the coming generation.
Bondi Beach Massacre 2025: FAQs on Australia's Deadliest Shooting Since Port Arthur
1. What happened at Bondi Beach in December 2025?
On December 14, 2025, during a Hanukkah celebration at Sydney's Bondi Beach, two gunmen, Sajid Akram (50) and his son Naveed (24), opened fire from an overpass, killing 15 people and injuring over 40. It was Australia's deadliest mass shooting since the 1996 Port Arthur massacre and was declared an act of antisemitic terrorism by Prime Minister Anthony Albanese.
2. What weapons were used in the Bondi Beach attack and were they legal?
The attackers used illegally modified semi-automatic rifles obtained through black market channels, exploiting a significant loophole in Australia's National Firearms Agreement established after Port Arthur.
3. How is Australia changing gun laws after the Bondi Beach shooting?
The attack has prompted urgent parliamentary debate on four key reforms: A real-time national firearms registry (currently 24-hour delay); Tighter border controls on firearm parts; Increased penalties for illegal modifications (up to 20 years imprisonment) and Mandatory mental health reporting to licensing authorities. measures aimed at closing gaps exposed by the attack.
4. Was the Bondi Beach attack related to rising antisemitism in Australia?
Yes. The attackers targeted a Jewish celebration while shouting extremist slogans, amid documented rising antisemitism, a 60% increase in incidents reported in 2024. The attack has triggered a $25 million security package for Jewish communities, mandatory Holocaust education in schools, and enhanced hate crime legislation.
5. How does the Bondi Beach casualty count compare to Port Arthur?
While Port Arthur (1996) had higher fatalities (35 vs. 15), Bondi 2025 recorded Australia's highest injury count (40+) in any mass shooting. This reflects both changes in attack methodology (urban crowded space vs. isolated tourist site) and improvements in emergency medical response that saved lives but left many severely injured.
A leading global company for Business Solutions , bringing the intriguing global business arena into your space to a business and financial savvy mind.
social media:
Stay In Touch
Don't hesitate. Reach us with these info.
0795046415financialshub01@gmail.comNairobi/Kenya
We create great content everyday. Subscribe to be the first notified when released.
.png)
.png)
.png)

.png)


.png)
.png)
%20(2).png)
%20(1).jpg)

.png)
.png)