6 min read
North American Markets Slump As Oil Prices Surge And Middle East Tensions Rise
NorthAmerica
Markets
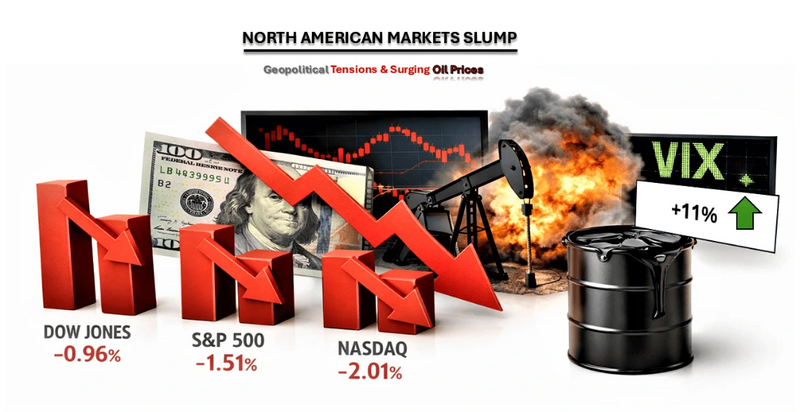
North American markets closed sharply lower on March 20, 2026, capping a volatile week marked by surging oil prices and escalating geopolitical tensions in the Middle East. The S&P 500, Nasdaq, Dow Jones, and TSX all posted significant declines, with U.S. equities suffering their fourth consecutive weekly loss.
Rising Treasury yields (10-year at 4.39%) and the Federal Reserve’s cautious stance on rate cuts fueled investor anxiety, while volatility spiked as measured by the VIX. Energy was the only sector to finish in positive territory, driven by oil hitting a 2026 high, while aerospace, semiconductors, and utilities led the declines.
Rising Treasury yields (10-year at 4.39%) and the Federal Reserve’s cautious stance on rate cuts fueled investor anxiety, while volatility spiked as measured by the VIX. Energy was the only sector to finish in positive territory, driven by oil hitting a 2026 high, while aerospace, semiconductors, and utilities led the declines.
Why Did the Stock Market Fall on March 20, 2026?
The markets experienced broad-based sell-offs which were driven by uncertainty surrounding the geopolitical tensions and higher oil prices. Rising Treasury yields and the Federal Reserve’s cautious outlook on interest rate cuts added to investor concerns, creating a risk-off environment across equities.
The markets experienced broad-based sell-offs which were driven by uncertainty surrounding the geopolitical tensions and higher oil prices. Rising Treasury yields and the Federal Reserve’s cautious outlook on interest rate cuts added to investor concerns, creating a risk-off environment across equities.
S&P 500, Nasdaq, and Dow Jones Performance
U.S. Equity Markets Performance
U.S. stocks suffered their fourth consecutive weekly loss, with major benchmarks closing at or near their lowest levels of the year.
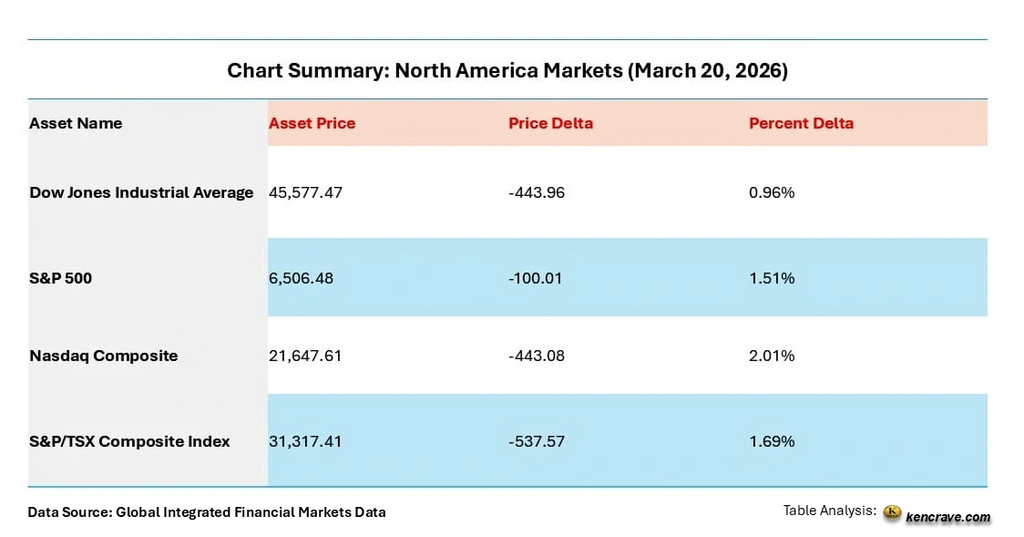
- S&P 500 Index: Declined 1.51% (100.01 points) to close at 6,506.48 marking its 4th consecutive weekly loss since the middle east conflict started. The index is now firmly below its 200-day moving average, ending a 214-session streak above that trendline.
- Nasdaq Composite: Fell 2.01% (443.08 points) to end at 21,647.61. The tech-heavy index was pressured by a "sharp weekly selloff driven by risk-off sentiment of growth sectors".
- Dow Jones Industrial Average: Dropped 0.96% (443.96 points) to 45,577.47.
- Russell 2000: The small-cap index sank 2.3% to 2,438.45, entering official correction territory by falling 10% from its previous peak.
Sector Winners and Losers in the S&P 500
Sector Performance Breakdown
The day was characterized by broad-based selling, with only one of the 11 major S&P 500 sectors managing a positive close.
Best Performer:
- Energy (+0.9%): The only sector which showed positive signs driven by oil prices hitting a 2026 high.
Worst Performers:
- Aerospace and Defense (-3.75%): Companies in this arena suffered the deepest decline among tracked industry sectors.
- Semiconductors (-3.43%): Pressured by Micron Technology Inc. (MU), which tumbled 4.81% after failing to impress with its Q3 fiscal 2026 guidance.
- Utilities (-3.1%): Hit hard by rising yields, which make these normally "safe" stocks less attractive.
-
Materials (-3.17%) and Automotive (-2.95%) also saw significant selling pressure by investors.
Key Takeaway: The markets experienced broad based sell offs driven by uncertainty in geopolitical tensions and higher oil prices.
Canadian Market: S&P/TSX Composite
Canada's primary index erased its entire 2026 gains during the session. The canadian market S&P/TSX Composite closed down on 1.69% (537.57 points) at 31,317.41.
Sector Impact: Financials on the TSX fell 0.69%, contributing to the broader index decline.
Sector Impact: Financials on the TSX fell 0.69%, contributing to the broader index decline.
What Rising Treasury Yields Mean for Investors
Fixed Income and Macro Factors
- Treasury Yields: U.S. 10-year Treasury yields spiked to 4.39%, their highest levels in months, as traders speculated the Fed would be in a difficulty situation of trying to cut the rates this year.
- Federal Reserve Stance: Earlier in the week, the Fed held interest rates steady at 3.50%-3.75%. Updated projections via the "dot plot" pointed to potentially just one cut for the remainder of 2026.
- Volatility: The CBOE Volatility Index (VIX), the market's "fear gauge," jumped 11.3% higher to close at 26.78 as investors’ panic entered the arena.
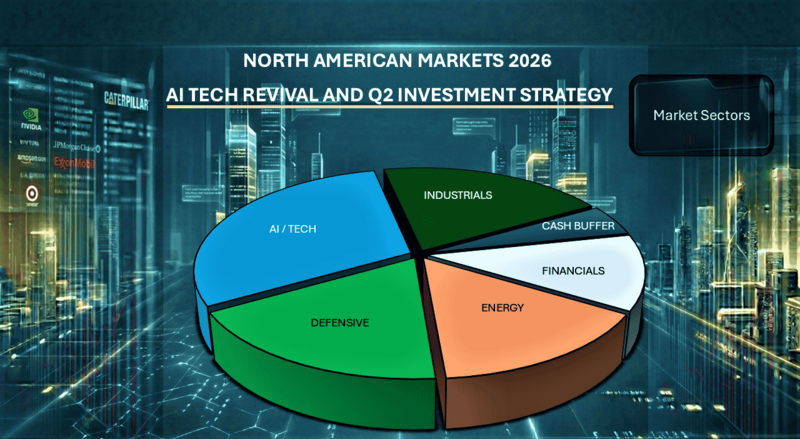
Investment Strategies During Market Volatility
Risk Management
- Stay defensive: With volatility (VIX at 26.78) spiking, prioritize defensive positioning. Consider sectors less sensitive to rate hikes and geopolitical shocks such as consumer staples and healthcare.
- Diversify globally: North American indices are under pressure; exposure to other geographical locations may reduce portfolio risk.
Sector Allocation
- Energy overweight: Rising oil prices supported energy stocks (+0.9%). Maintaining or modestly increasing exposure could hedge against inflationary pressures.
- Avoid rate-sensitive sectors: Utilities (-3.1%) and financials are vulnerable to higher yields. Limit exposure until bond markets stabilize.
- Caution in growth/tech: Nasdaq’s sharp decline highlights risk-off sentiment in semiconductors and growth sectors. Selectivity is key.
Fixed Income Strategy
- Reassess bond holdings: U.S. 10-year yields at 4.39% suggest further upward pressure. Shorter-duration bonds may be safer than long-duration Treasuries.
- Monitor Fed policy: With only one projected cut in 2026, rate-sensitive assets may remain under strain thus the need to position accordingly.
Market Tactical Moves
- Cash buffer zone: Holding some cash provides flexibility to buy during dips without being forced to sell at losses in the markets
- Hedge exposure: Consider hedging strategies (options, inverse ETFs) to protect against further downside.
- Focus on quality companies: Make a consideration of companies with strong balance sheets and pricing power positions as they are better positioned in inflationary and uncertain environment exposures.
Macro Awareness
- Track geopolitical developments: Middle East tensions are driving oil and volatility. Investors should remain alert that new situation developments especially in the Middle East could shift sentiments quickly.
- Be aware of inflation triggers: Rising energy costs may reignite inflation concerns, delaying FED rate cuts therefore the need to adjust expectations for monetary easing.
Key Takeaways
- Broad Market Weakness: All major U.S. and Canadian indices ended at lower levels which confirms a risk-off environment.
- Sector Divergence: The Energy outperformed due to oil strength, while aerospace, semiconductors, and utilities saw steep declines.
- Macro Pressure: Rising Treasury yields and limited Fed rate cut projections weighed heavily on equities market.
- Volatility Surge: The VIX jumped over 11%, signaling heightened investor fear and uncertainty.
Investor Implication: Defensive positioning, selective sector exposure, and shorter-duration bonds remain prudent strategies.
FAQs
1. Why did the markets slump?
Geopolitical tensions and surging oil prices reignited inflation fears, compounded by the Fed’s cautious stance.
2. Which sectors were most affected?
Energy gained, but aerospace, semiconductors, utilities, materials, and automotive all saw sharp declines.
3. What do yields and volatility indicate? Higher Treasury yields suggest reduced expectations for rate cuts, while the VIX spike reflects growing investor fear.
4. Why do rising oil prices affect stock markets?
Higher oil prices increase production and transportation costs, which can push inflation higher and reduce corporate profit margins.
5. What sectors perform best during geopolitical tensions?
Energy, defense, healthcare and commodities often outperform because demand rises during periods of global instability.
Energy, defense, healthcare and commodities often outperform because demand rises during periods of global instability.
6. Should investors buy during a market slump?
Many investors view market downturns as opportunities to accumulate quality companies at discounted prices, provided their long-term outlook remains strong.
Many investors view market downturns as opportunities to accumulate quality companies at discounted prices, provided their long-term outlook remains strong.

Senior Editor: Kenneth Njoroge
Business & Financial Expert | MBA | Bsc. Commerce | CPA
Author Name
Author intro
Author bio goes here.